Various drawings, images and screenshots that I've created with code.
Inspired by Ned Batchelder's Math factoid of the day: 63
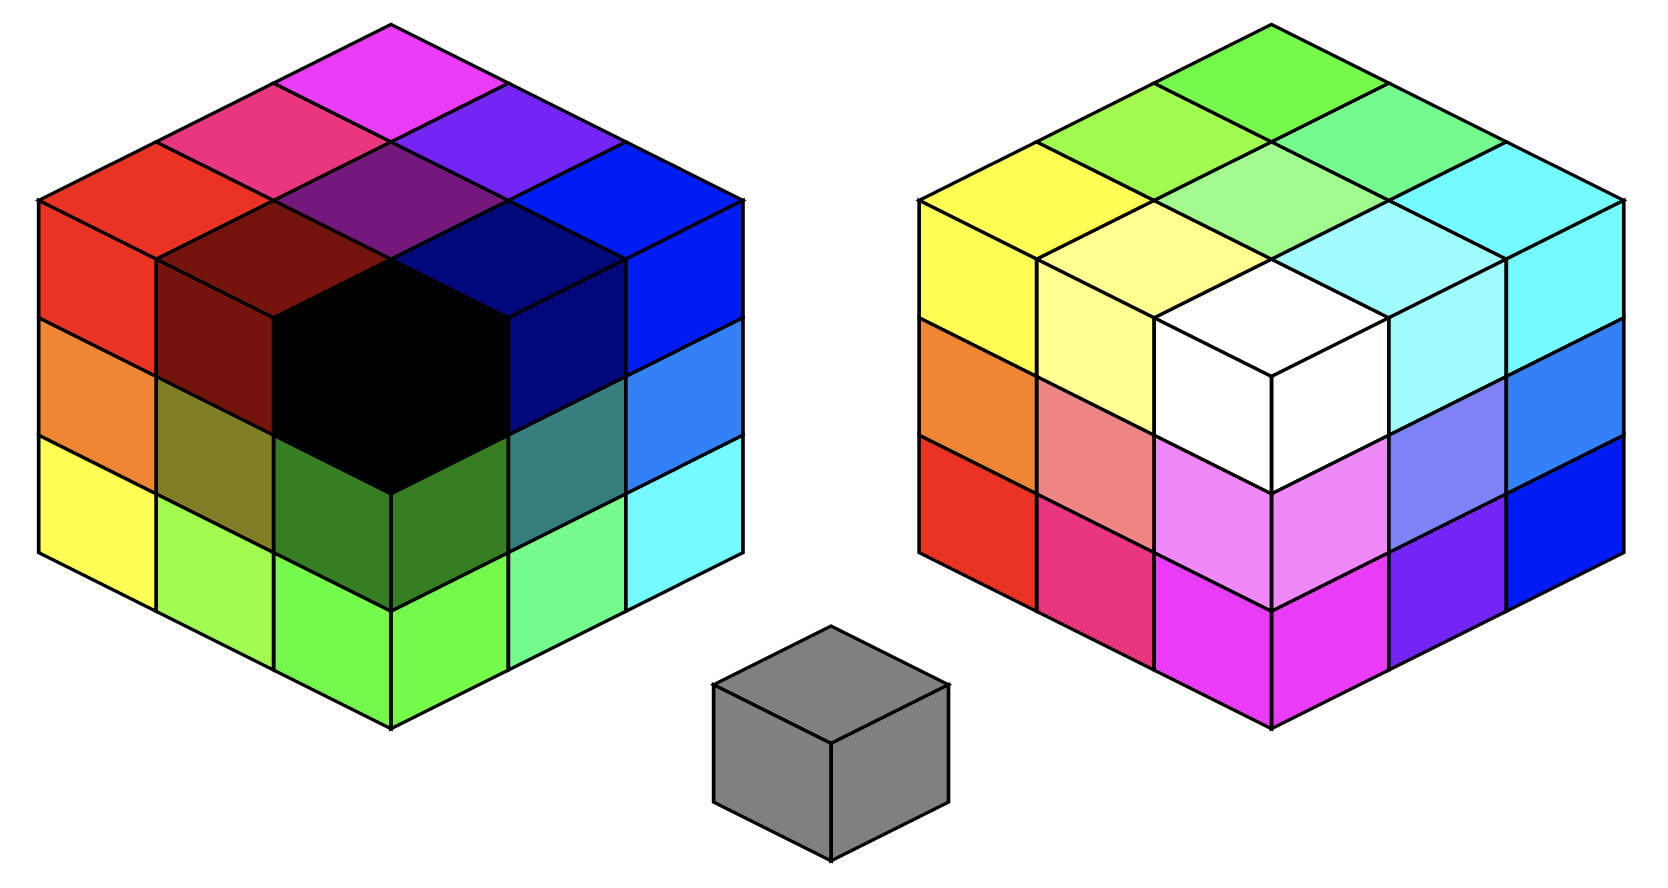
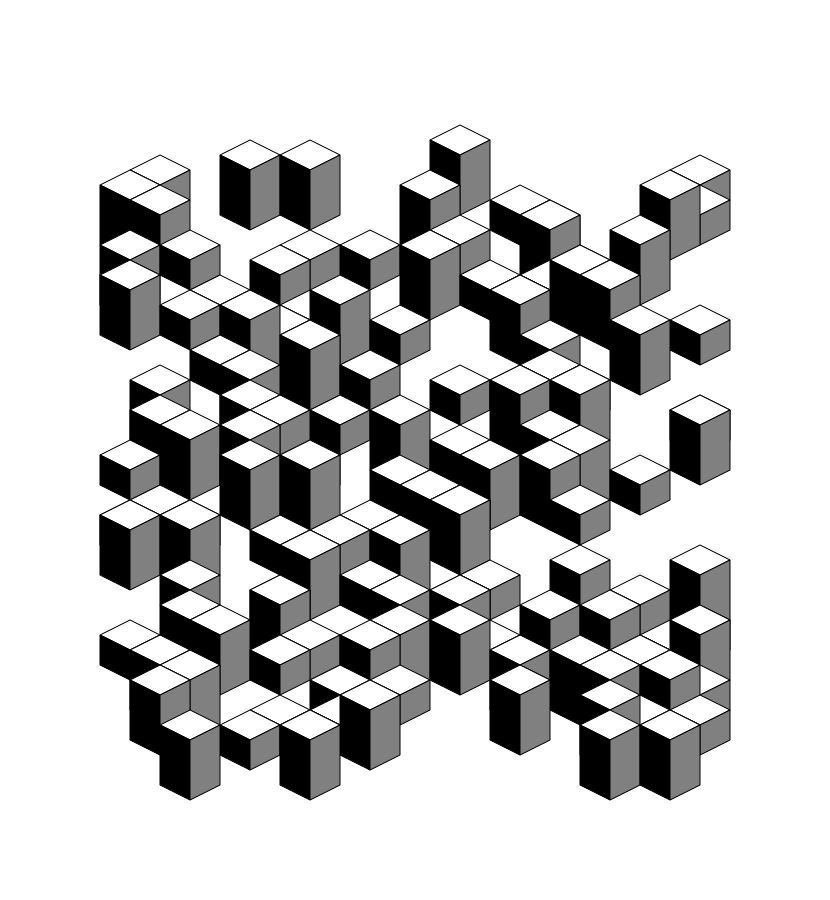
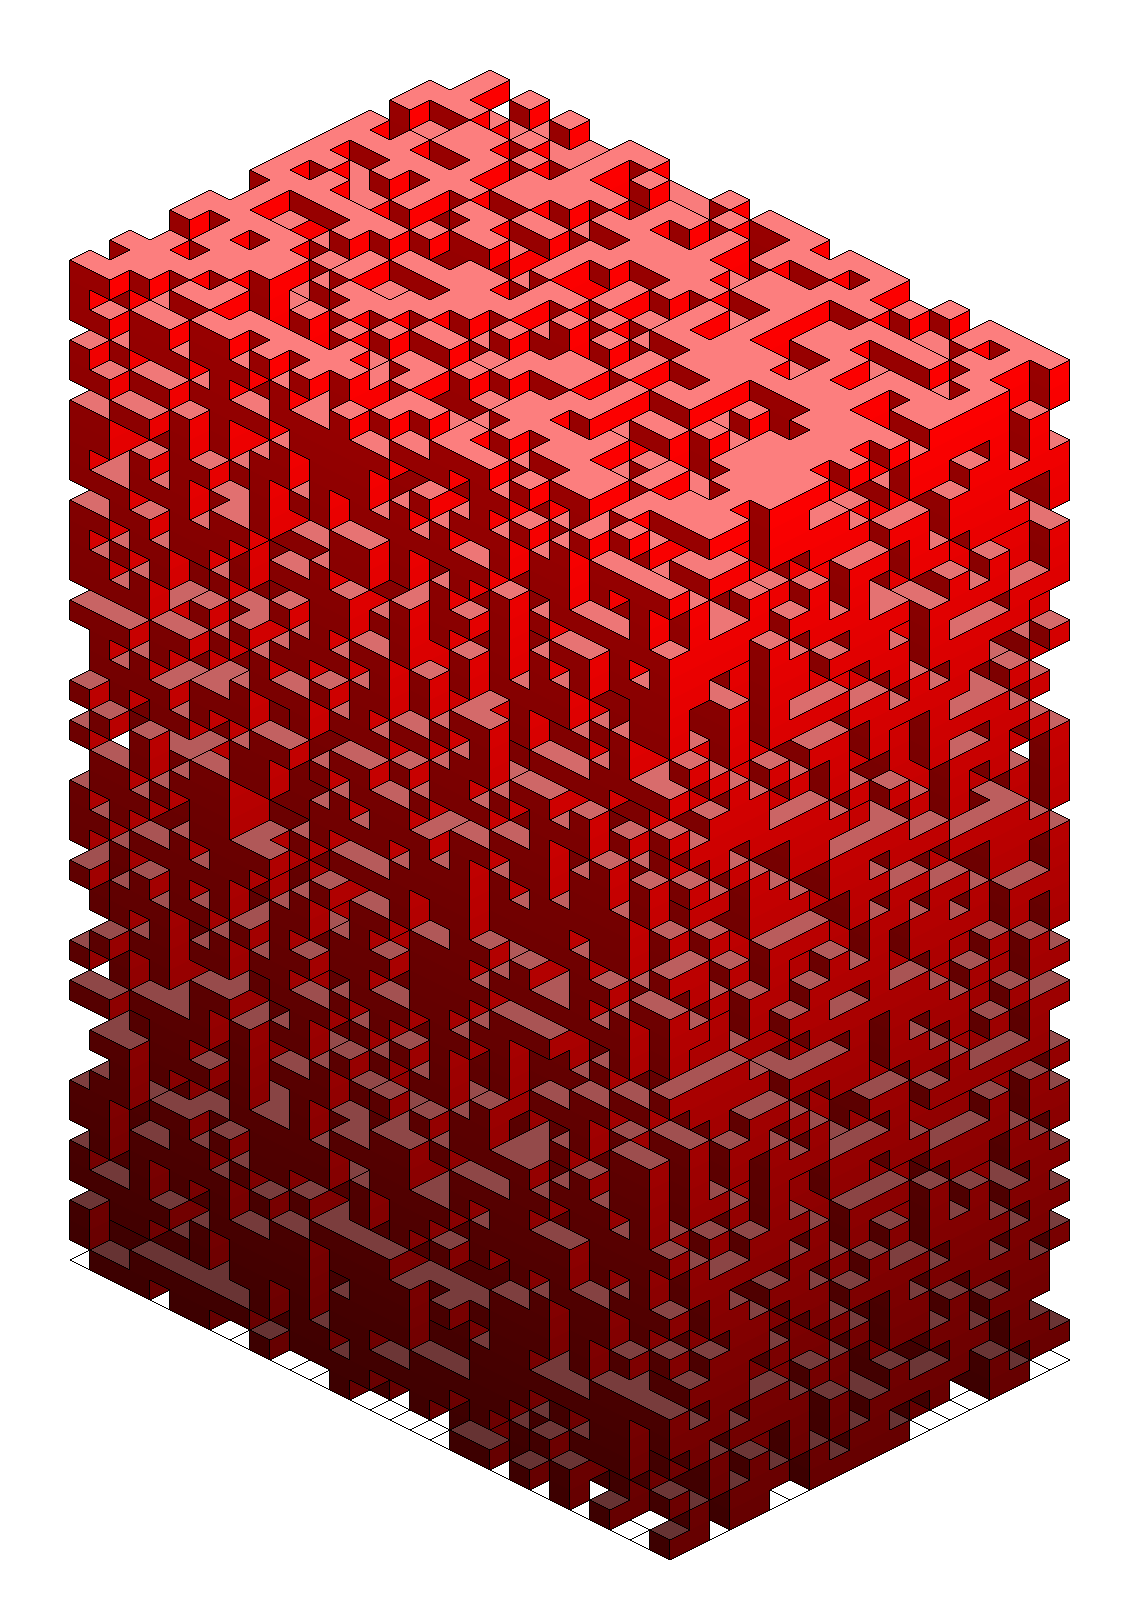
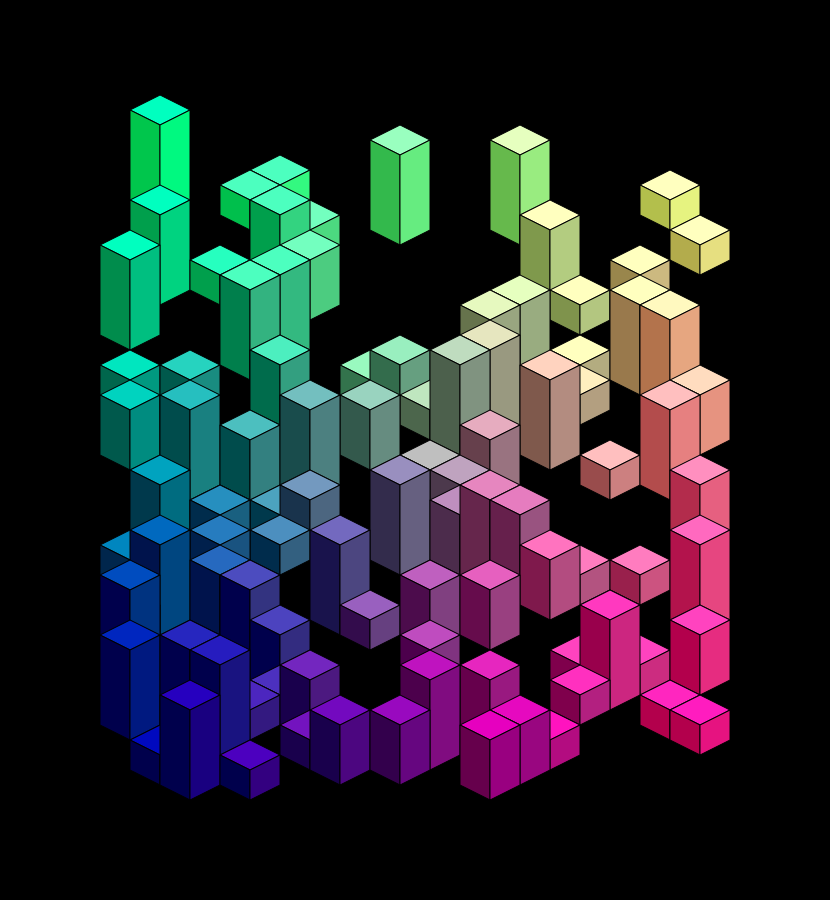
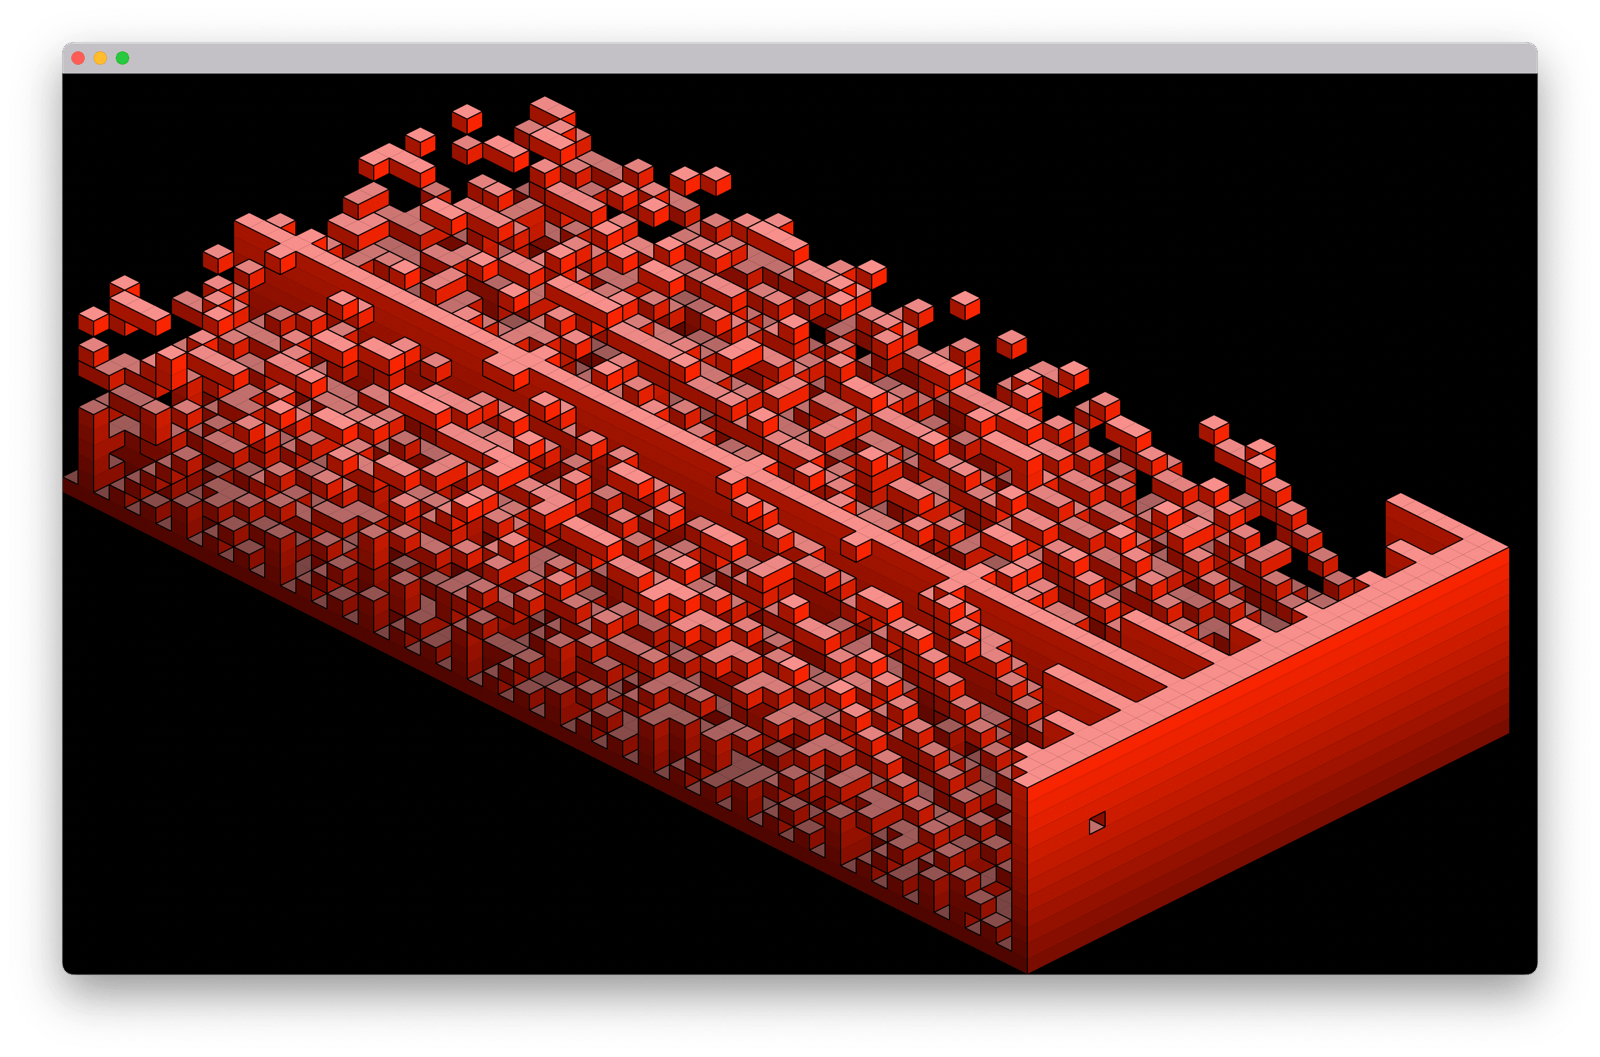
In the late 1700’s René Just Haüy developed a theory about how crystals formed: successive layers of fundamental primitives in orderly arrangements. One of those arrangements was stacking cubes together to make an octahedron.
This animation shows eight generations of three crystal seeds growing inside a 32×32×32 cube with transparent faces, revealing the crystals' internal structure.
Source: PostScript
BlueSky: https://bsky.app/profile/nedbat.com/post/3lsm2cuvsbk2c
Full version: cube.ps
8 lines version: cube_631.ps
200 250 translate/D{def}def/M{mul}D/Z{2000000{}repeat}D/P 50 D/N{P neg}D/G{get}D
/a 0 D/b 0 D/c 0 D/o{0 G}D/O{1 G}D{/v[[N N N][P N N][P P N][N P N][N N P][P N P]
[P P P][N P P]]D/w 8 array D/f a cos D/d b cos D/e c cos D/s a sin D/t b sin D/u
c sin D 0 1 7{/i exch D/p v i G D/y p O f M p 2 G s M sub D/z p O s M p 2 G f M
add D/x p o d M z t M add D w i[x e M y u M sub x u M y e M add]put}for[[0 1][1
2][2 3][3 0][4 5][5 6][6 7][7 4][0 4][1 5][2 6][3 7]]{/E exch D w E o G o w E o
G O moveto w E O G o w E O G O lineto}forall 0 setgray stroke flushpage Z 1
setgray -100 dup 200 dup rectfill/a a 0.1 add D/b b 0.3 sub D/c c 0.5 sub D}loop
Amstrad CPC Color Palette in PostScript
Reproducing an early 90s Macintosh screensaver with PyGame.
Originally created as a programming workshop for my kids.
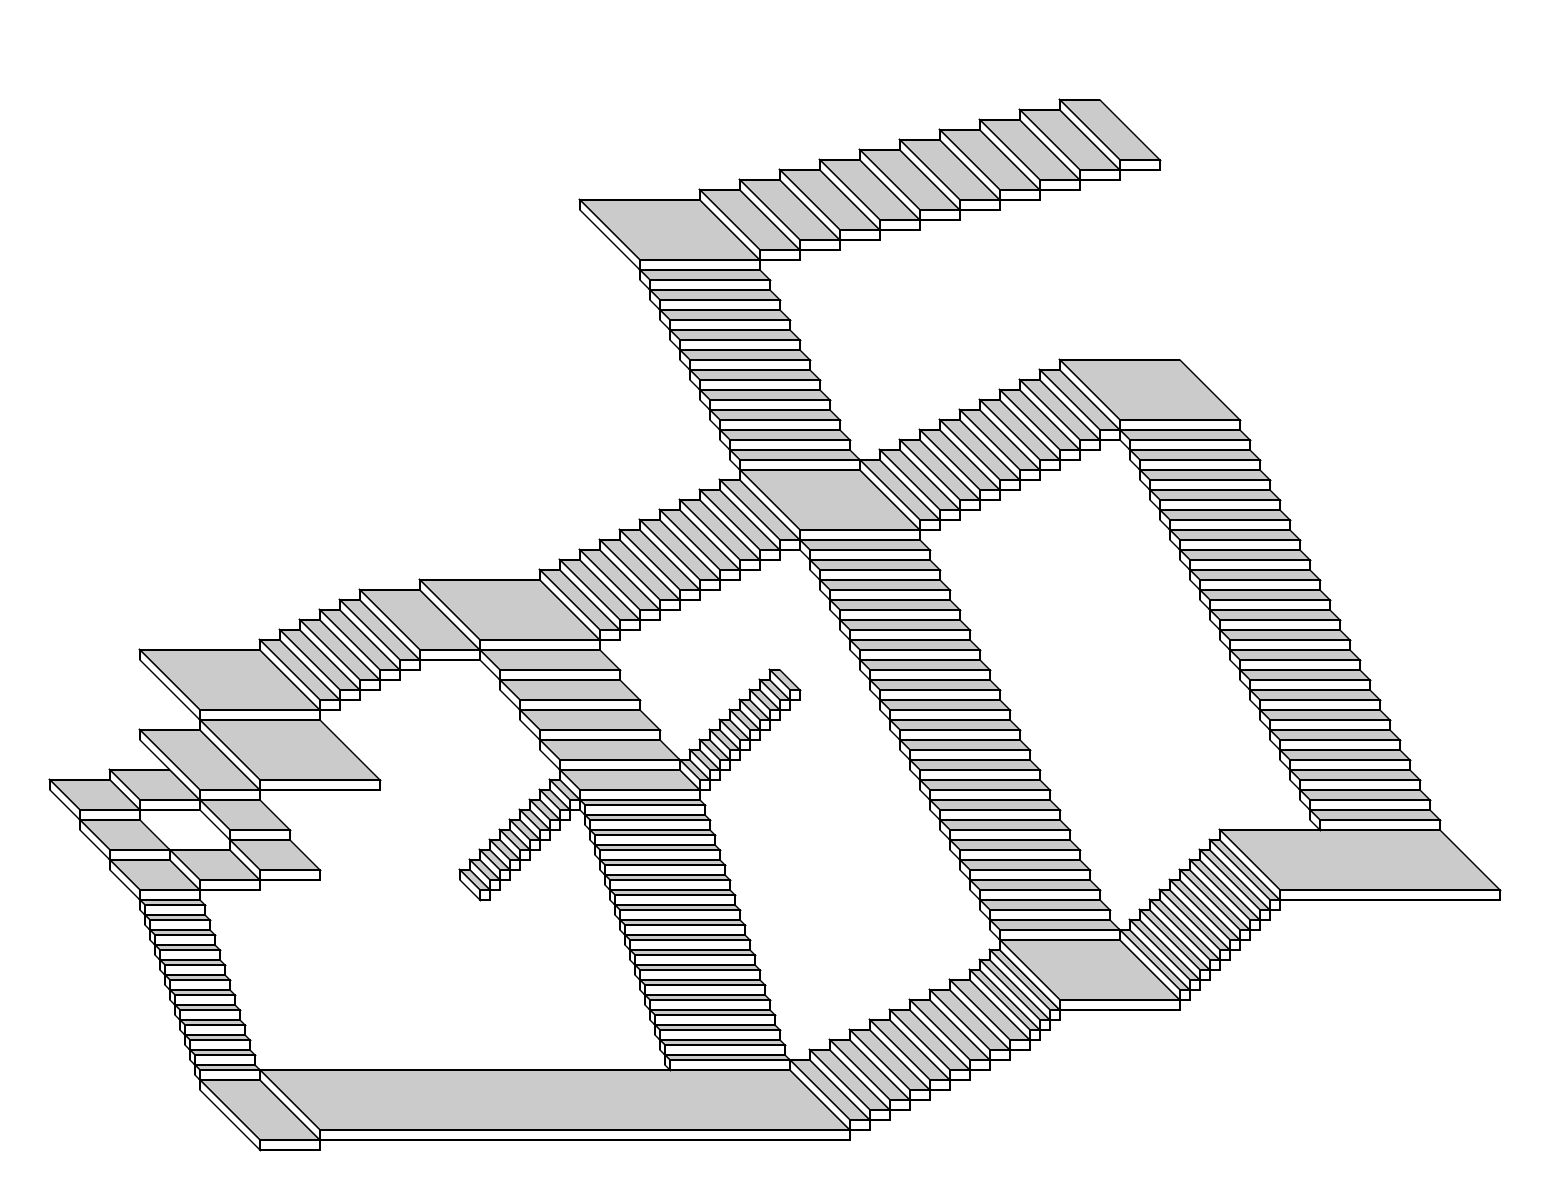
Isometric stairs in minimal Postscript
<>setpagedevice/S 5 def/f{/M exch def/C exch def/h exch def
/w exch def gsave M concat C setgray 0 0 w h rectfill 0 setgray 0 0 w h
rectstroke grestore}def/b{/H exch def/W exch def gsave W H 2 div 0.8[1 0 -1 1 0
S]f W S 1[1 0 0 1 0 0]f H 2 div S 1[-1 1 0 1 0 0]f grestore}def/U{/H2 exch def{
H 2 div neg H 2 div S add translate W H2 b}repeat}def/D{/H exch def{H 2 div H 2
div neg S sub translate W H b}repeat}def/L{/W2 exch def{W2 neg S neg translate
W2 H b}repeat}def/R{/W2 exch def{W S translate W2 H b}repeat}def/s{save}def/r{
restore}def/W 60 def/H 60 def 100 200 translate 2 30 L 2 30 D s 12 5 D 1 60 D 1
265 R 9 10 R 4 5 R r 2 30 R 1 30 U 1 60 U 1 60 R 1 60 U 5 10 R 1 30 R 1 60 R s
5 20 D s 10 5 L r s 18 5 D r 10 5 R r 10 10 R 1 60 R s 20 10 D 1 60 D 10 5 R 1
110 R r s 10 10 U 1 60 U 10 20 R r 10 10 R 1 60 R 20 10 D
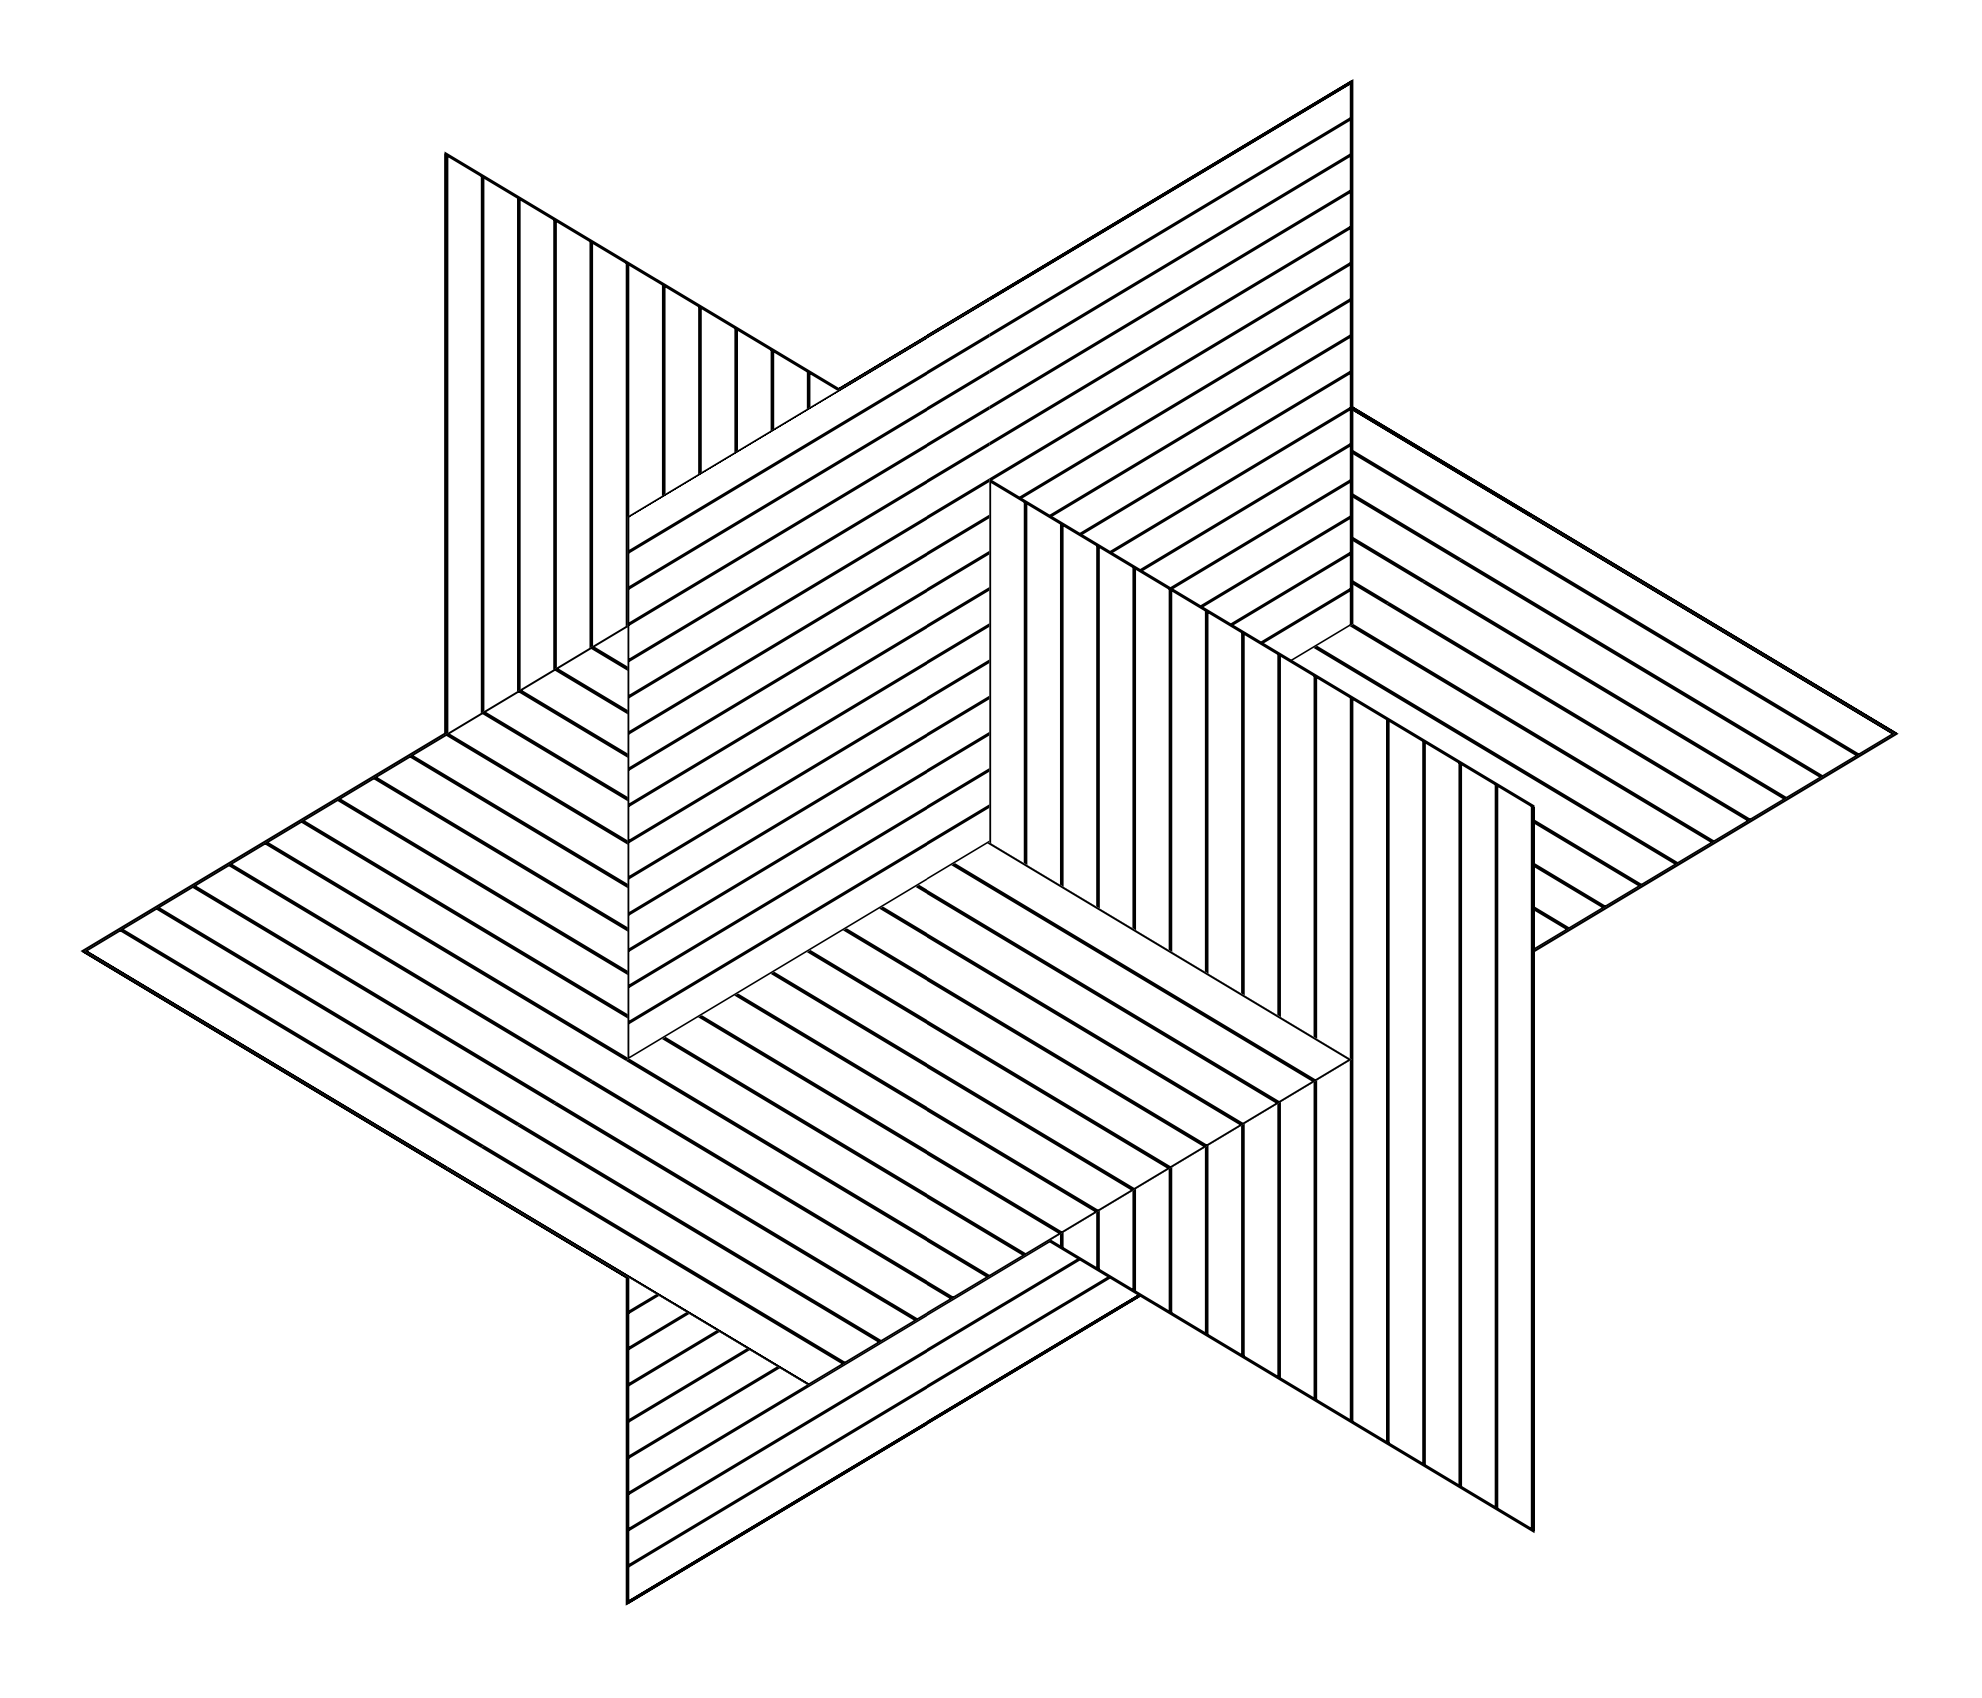
How to draw these three intersecting planes in Postscript, and shrink the code down to 5 lines?
%!PS
200 200 translate/W 300 def/H 200 def/w 150 def/h 100 def/P{1 setgray 0 0 W H
rectfill 0 setgray 0 0 W H rectstroke 0 10 W{dup 0 moveto H lineto}for stroke}
def/A[1 0.6 -1 0.6 50 60]def/B[0 1 1 0.6 0 0]def/C[1 -0.6 0 1 -50 200]def/p{
gsave concat exec P grestore}def 1 0 0{}A p 0 1 0{}B p 1 0 0{0 0 W h rectclip}A
p 0 0 1{}C p 1 0 0{0 0 w H rectclip}A p 0 1 0{w 0 w h rectclip}B p showpage
How to draw Swissquote logo with only 3 lines of Postscript:
%!PS
2.5 2.5 scale /l { lineto } def 1 0.4 0.2 setrgbcolor
(@>CC30TFCF>J>MC30TPCP>T>TJ<J<><NH41HHD0x) { 48 sub 5 mul } forall
arc fill setgray rectfill moveto l l l l l arc l l l arc l fill showpage
![]()
Source: (Postscript) https://gist.github.com/nst/696c31566a283588b7933415b3bd6aae
See also: https://twitter.com/nst021/status/1572249779480178690
Coding exercise with Émilien (10 years old).
Source: (Python) https://gist.github.com/nst/c689416bf23cccfc858e0f184280d7ed
Source: (Postscript) https://gist.github.com/nst/58b9d2b2bc70247bff1bddc4f5a80822
See also: https://twitter.com/nst021/status/1570047611989540865
Intertwined threads, knots and knitting figures with PyCairo.
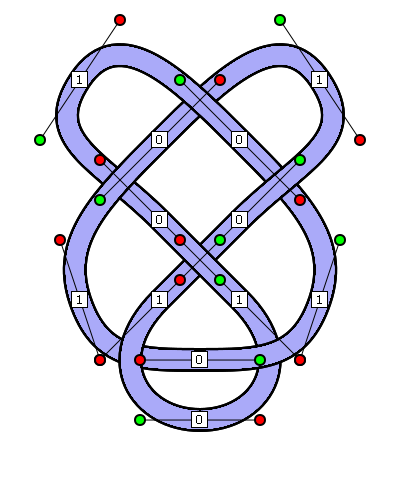
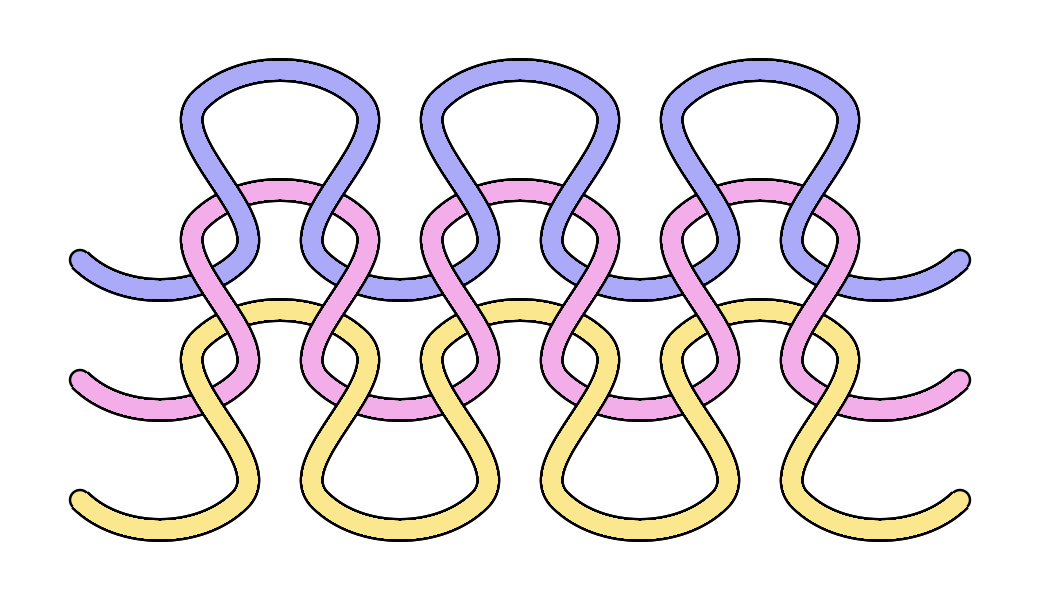
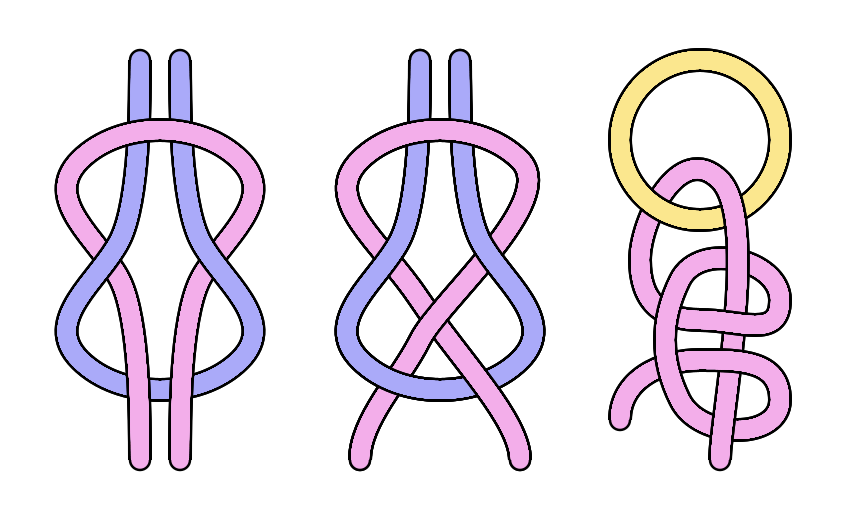
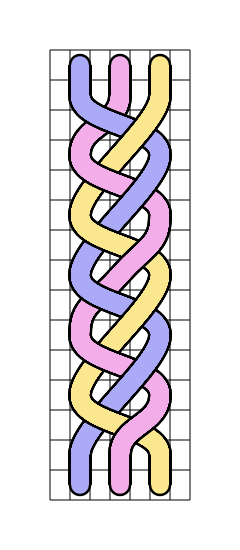
Source: Intertwined
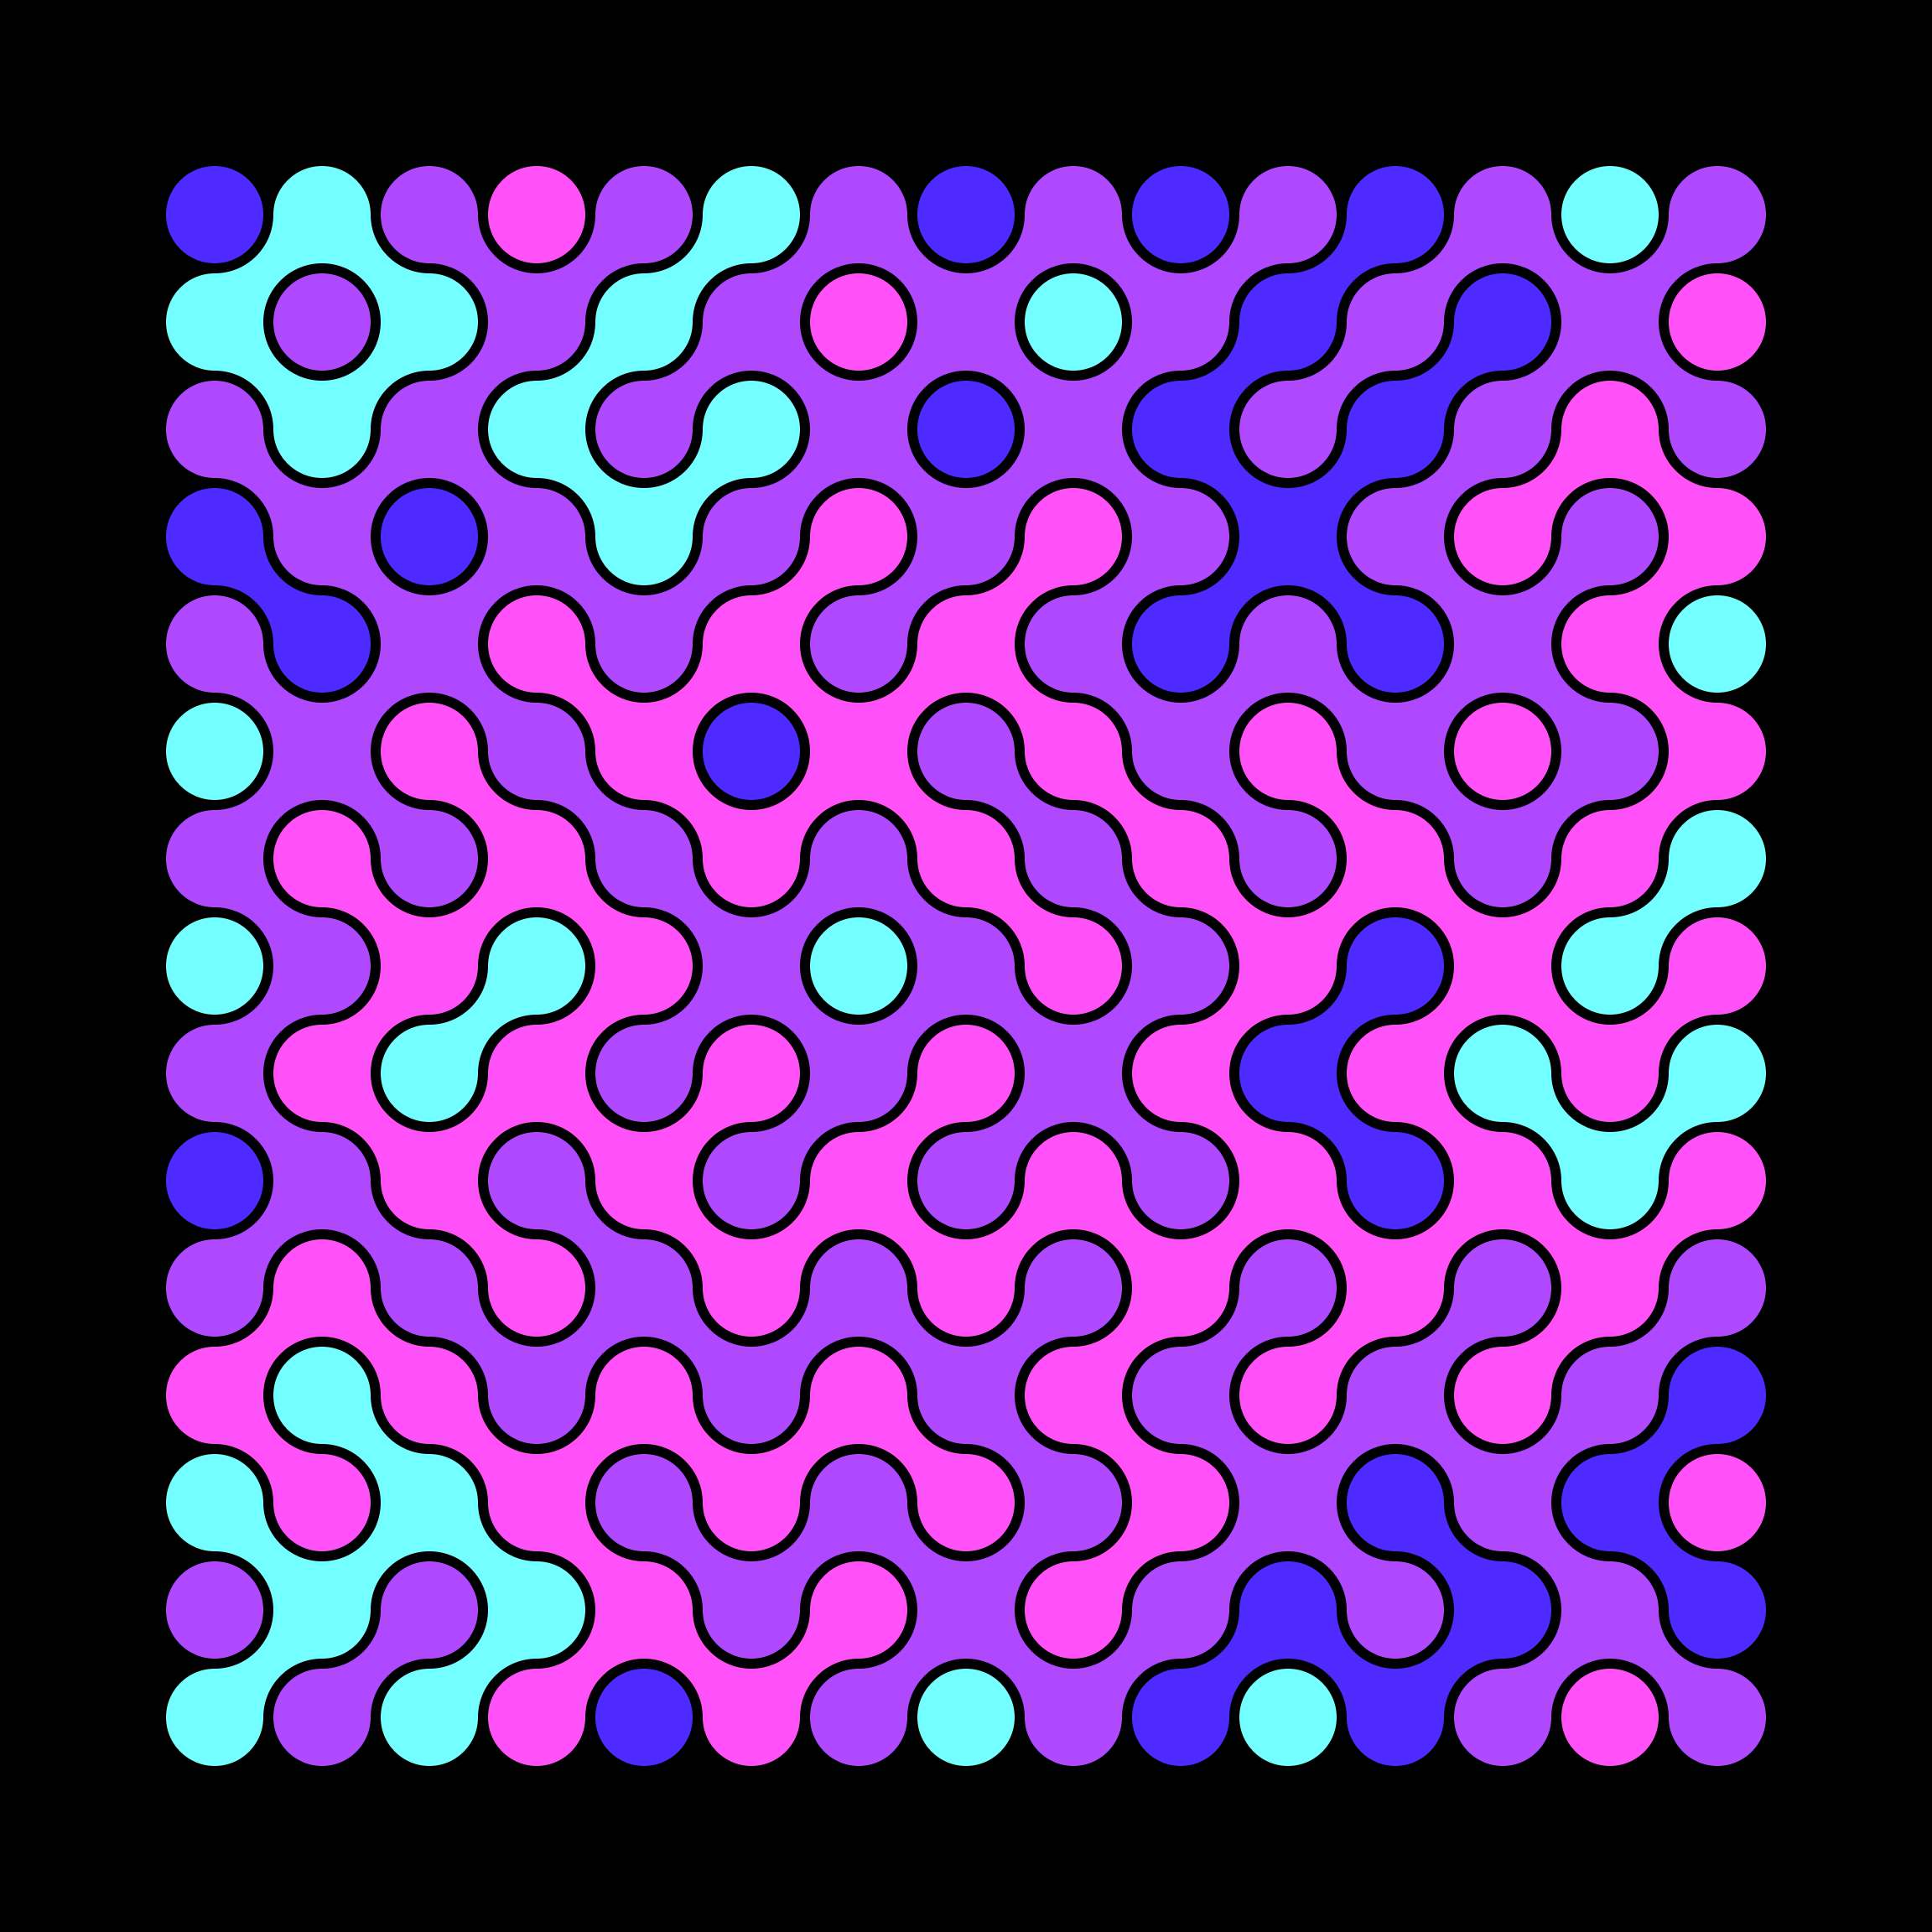
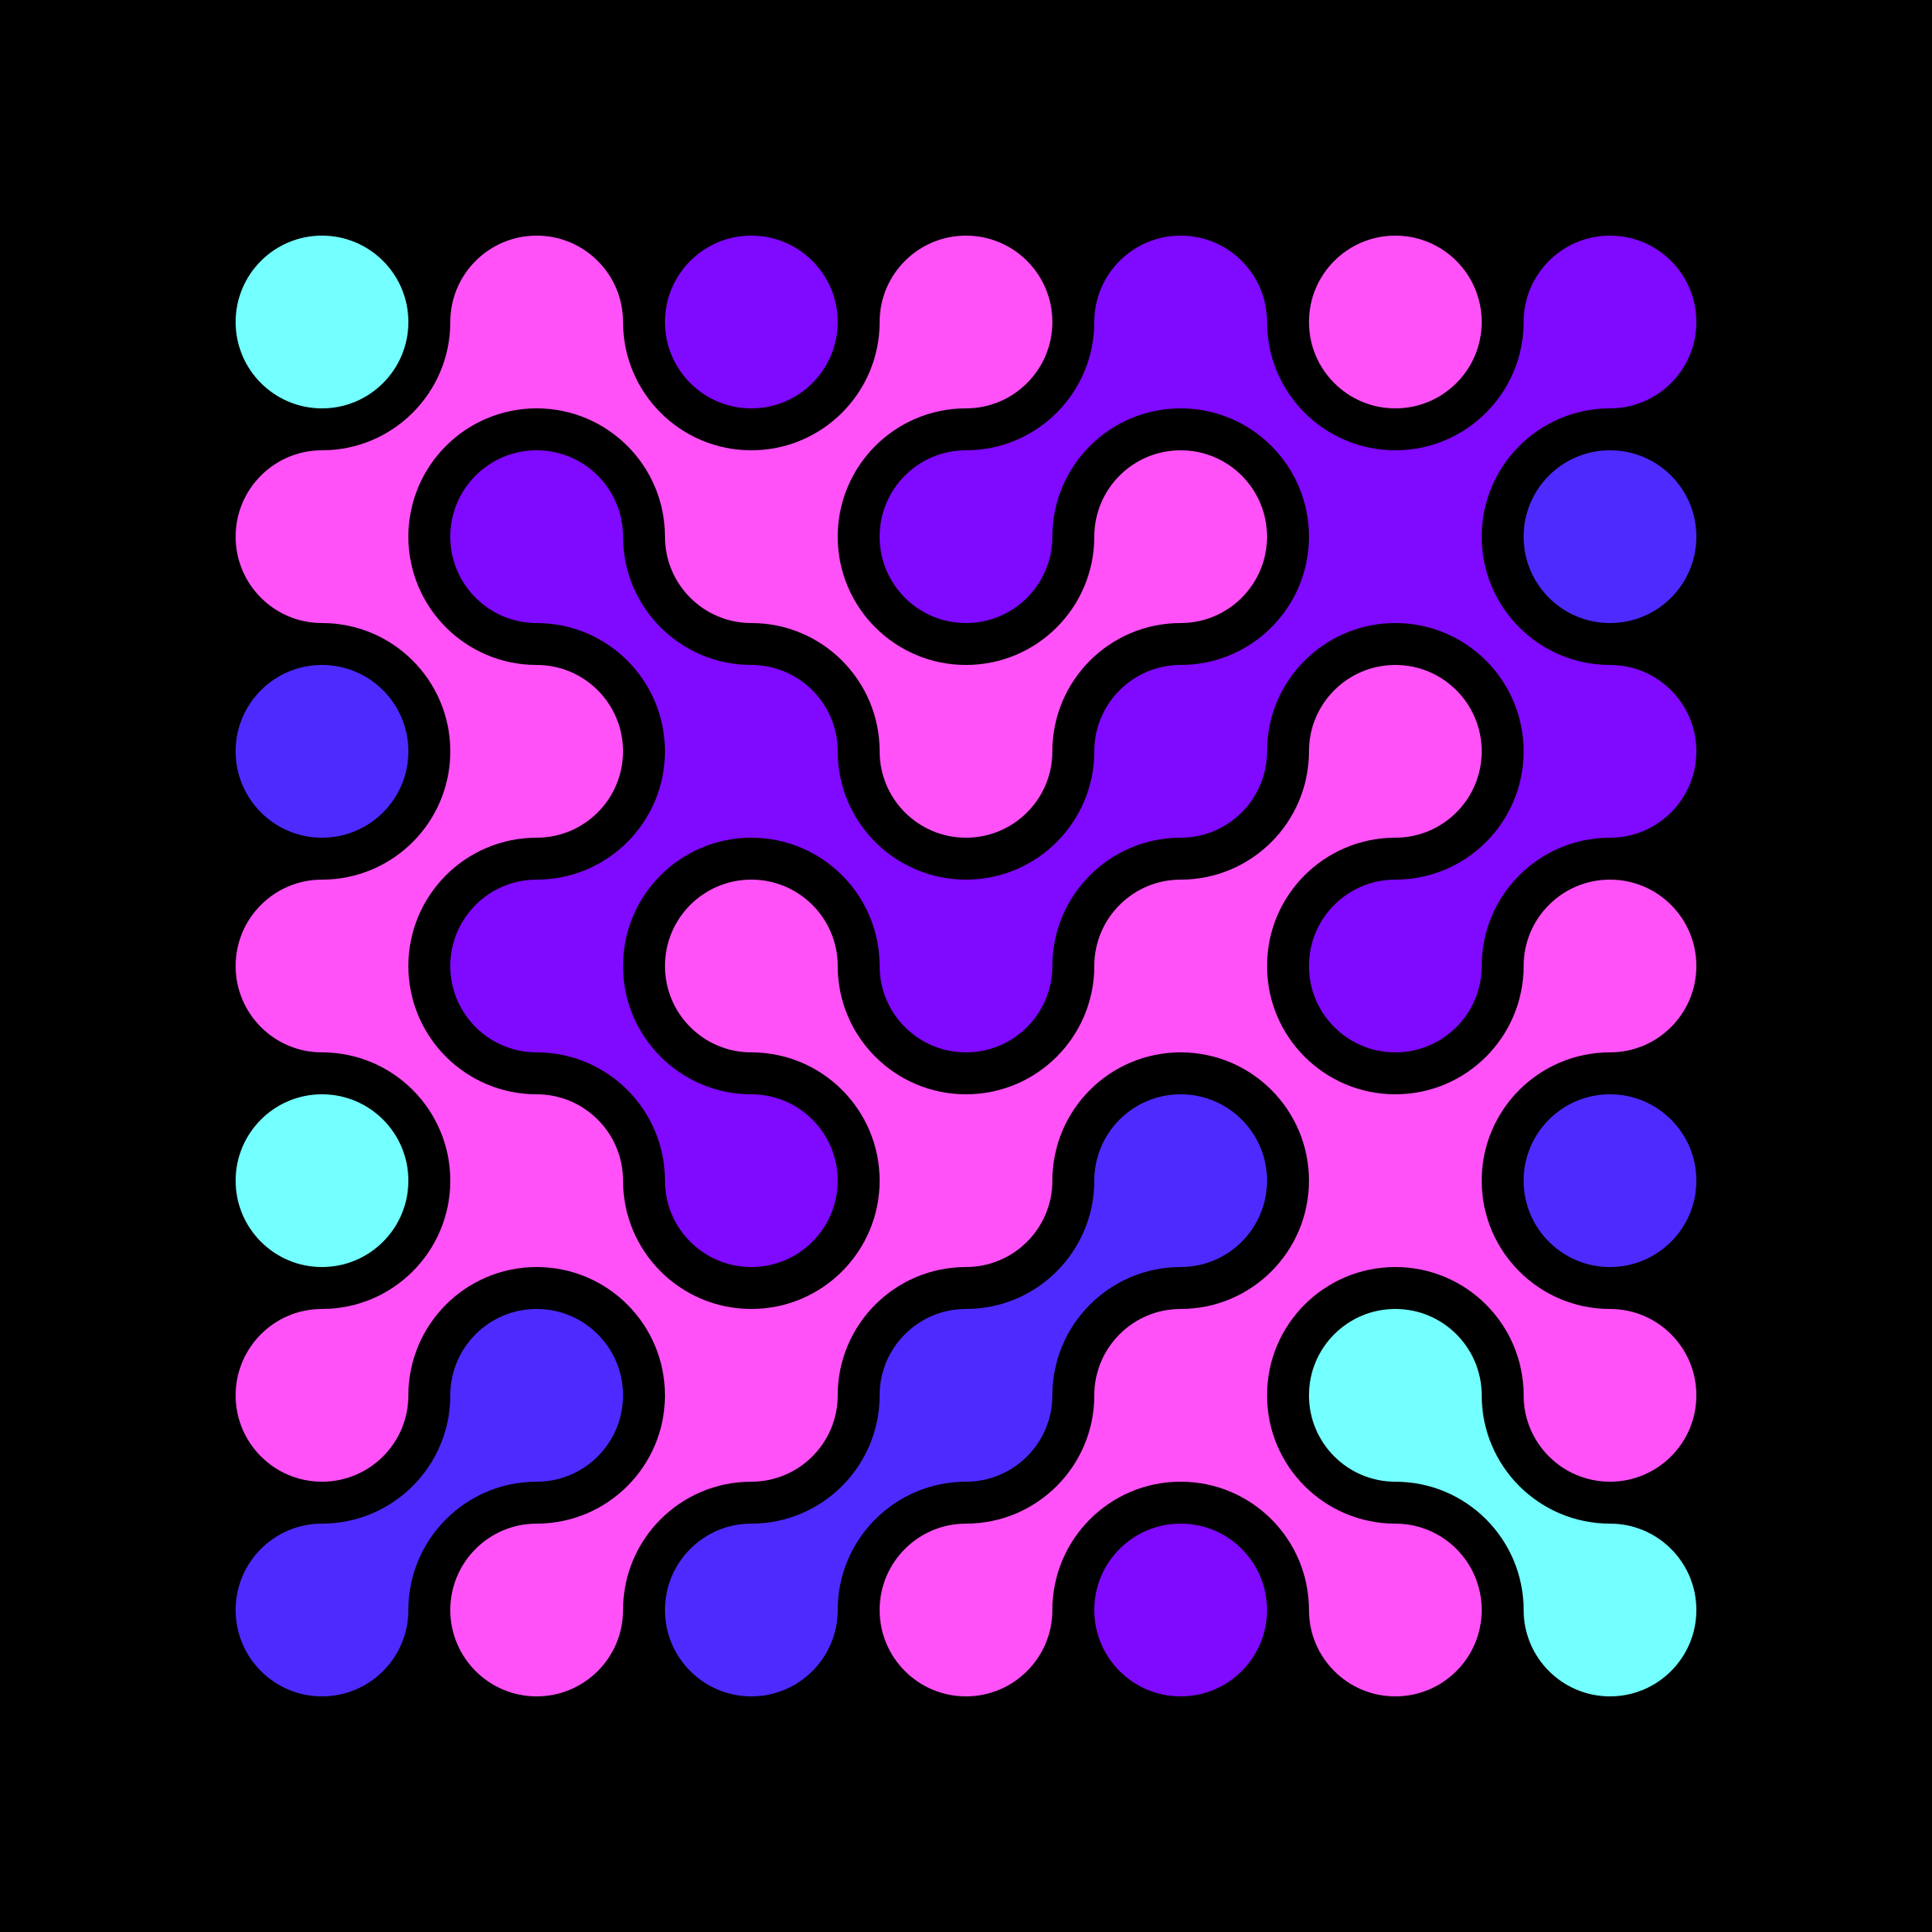
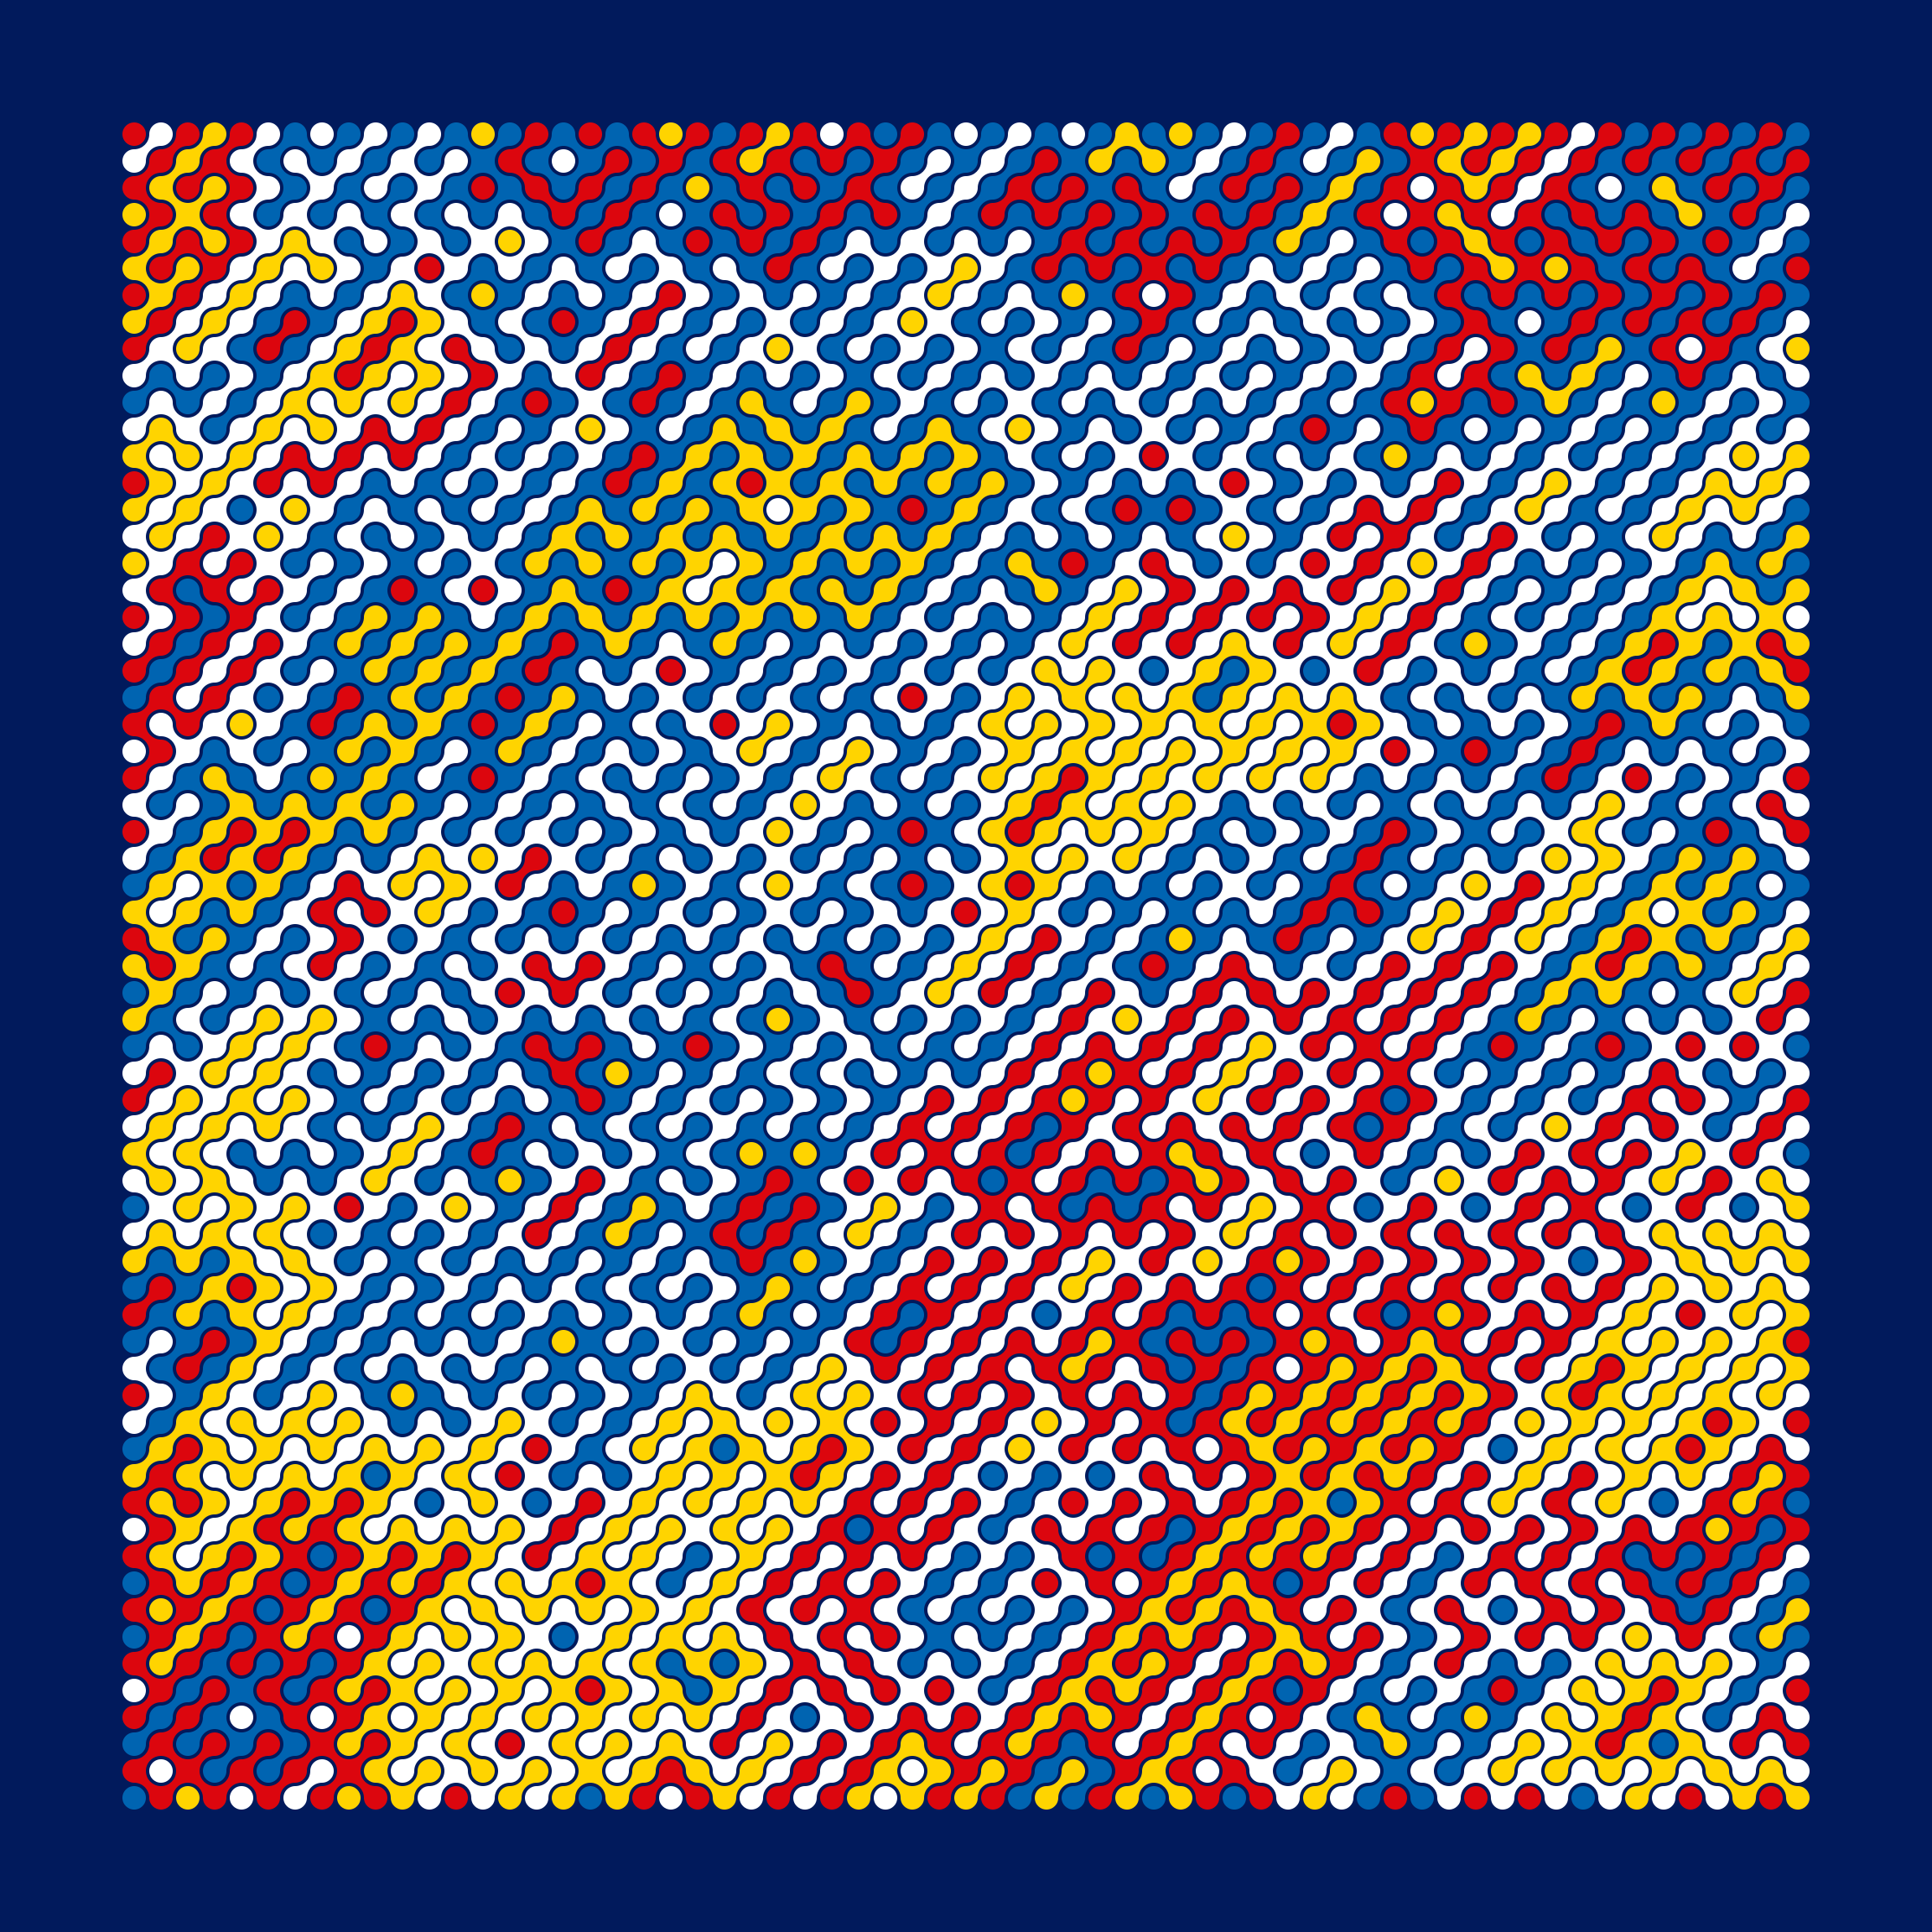
Complex patterns from simple tiles, with just a few lines of Python.
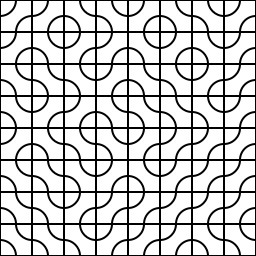
Source: truchet_simple.py
Source: truchet_2.py
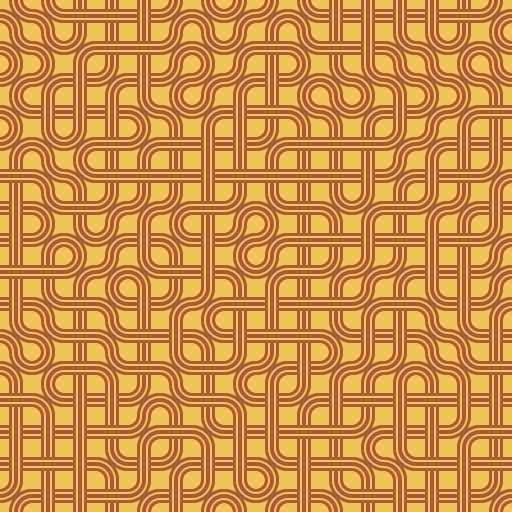
Reproducing Roni Kaufman's art with PyCairo.
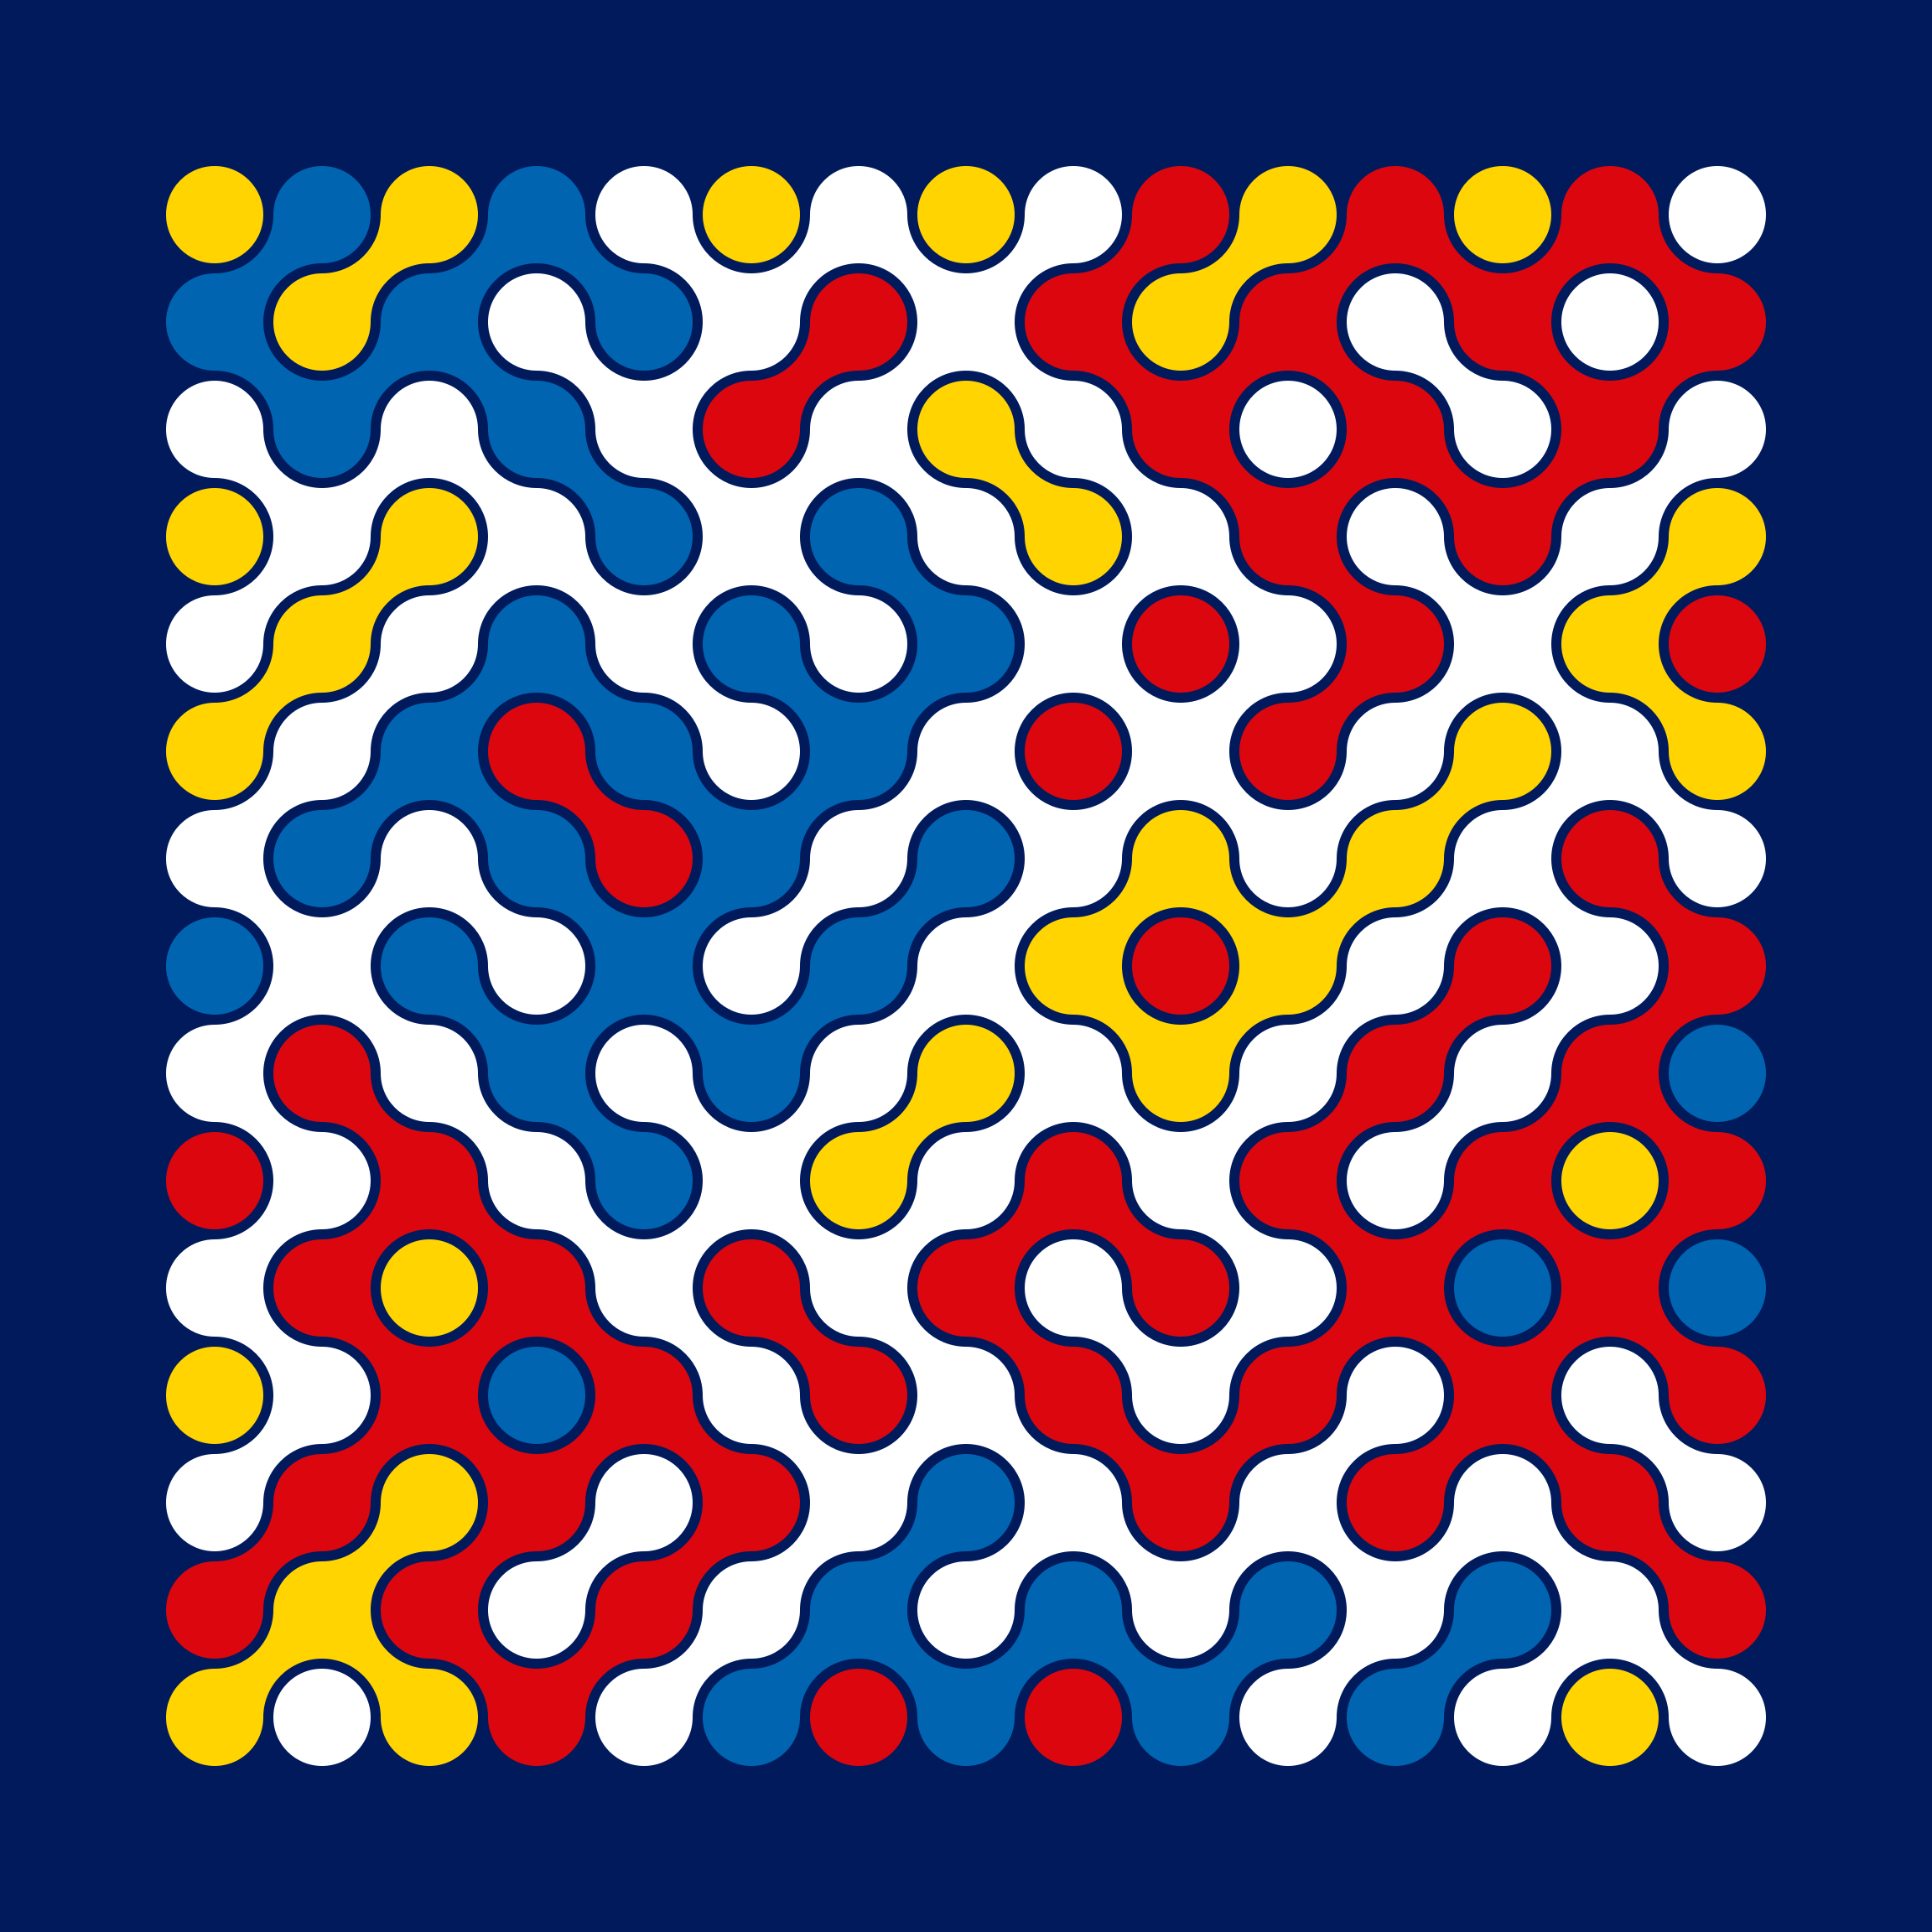
Source: truchet.py
Misc. variations created with the kids:
Inspired by @bendotk.
Sources: iso.py, iso4.py, iso7.py, IsoRenderer
macOS Screensaver
GitHub: Isometric
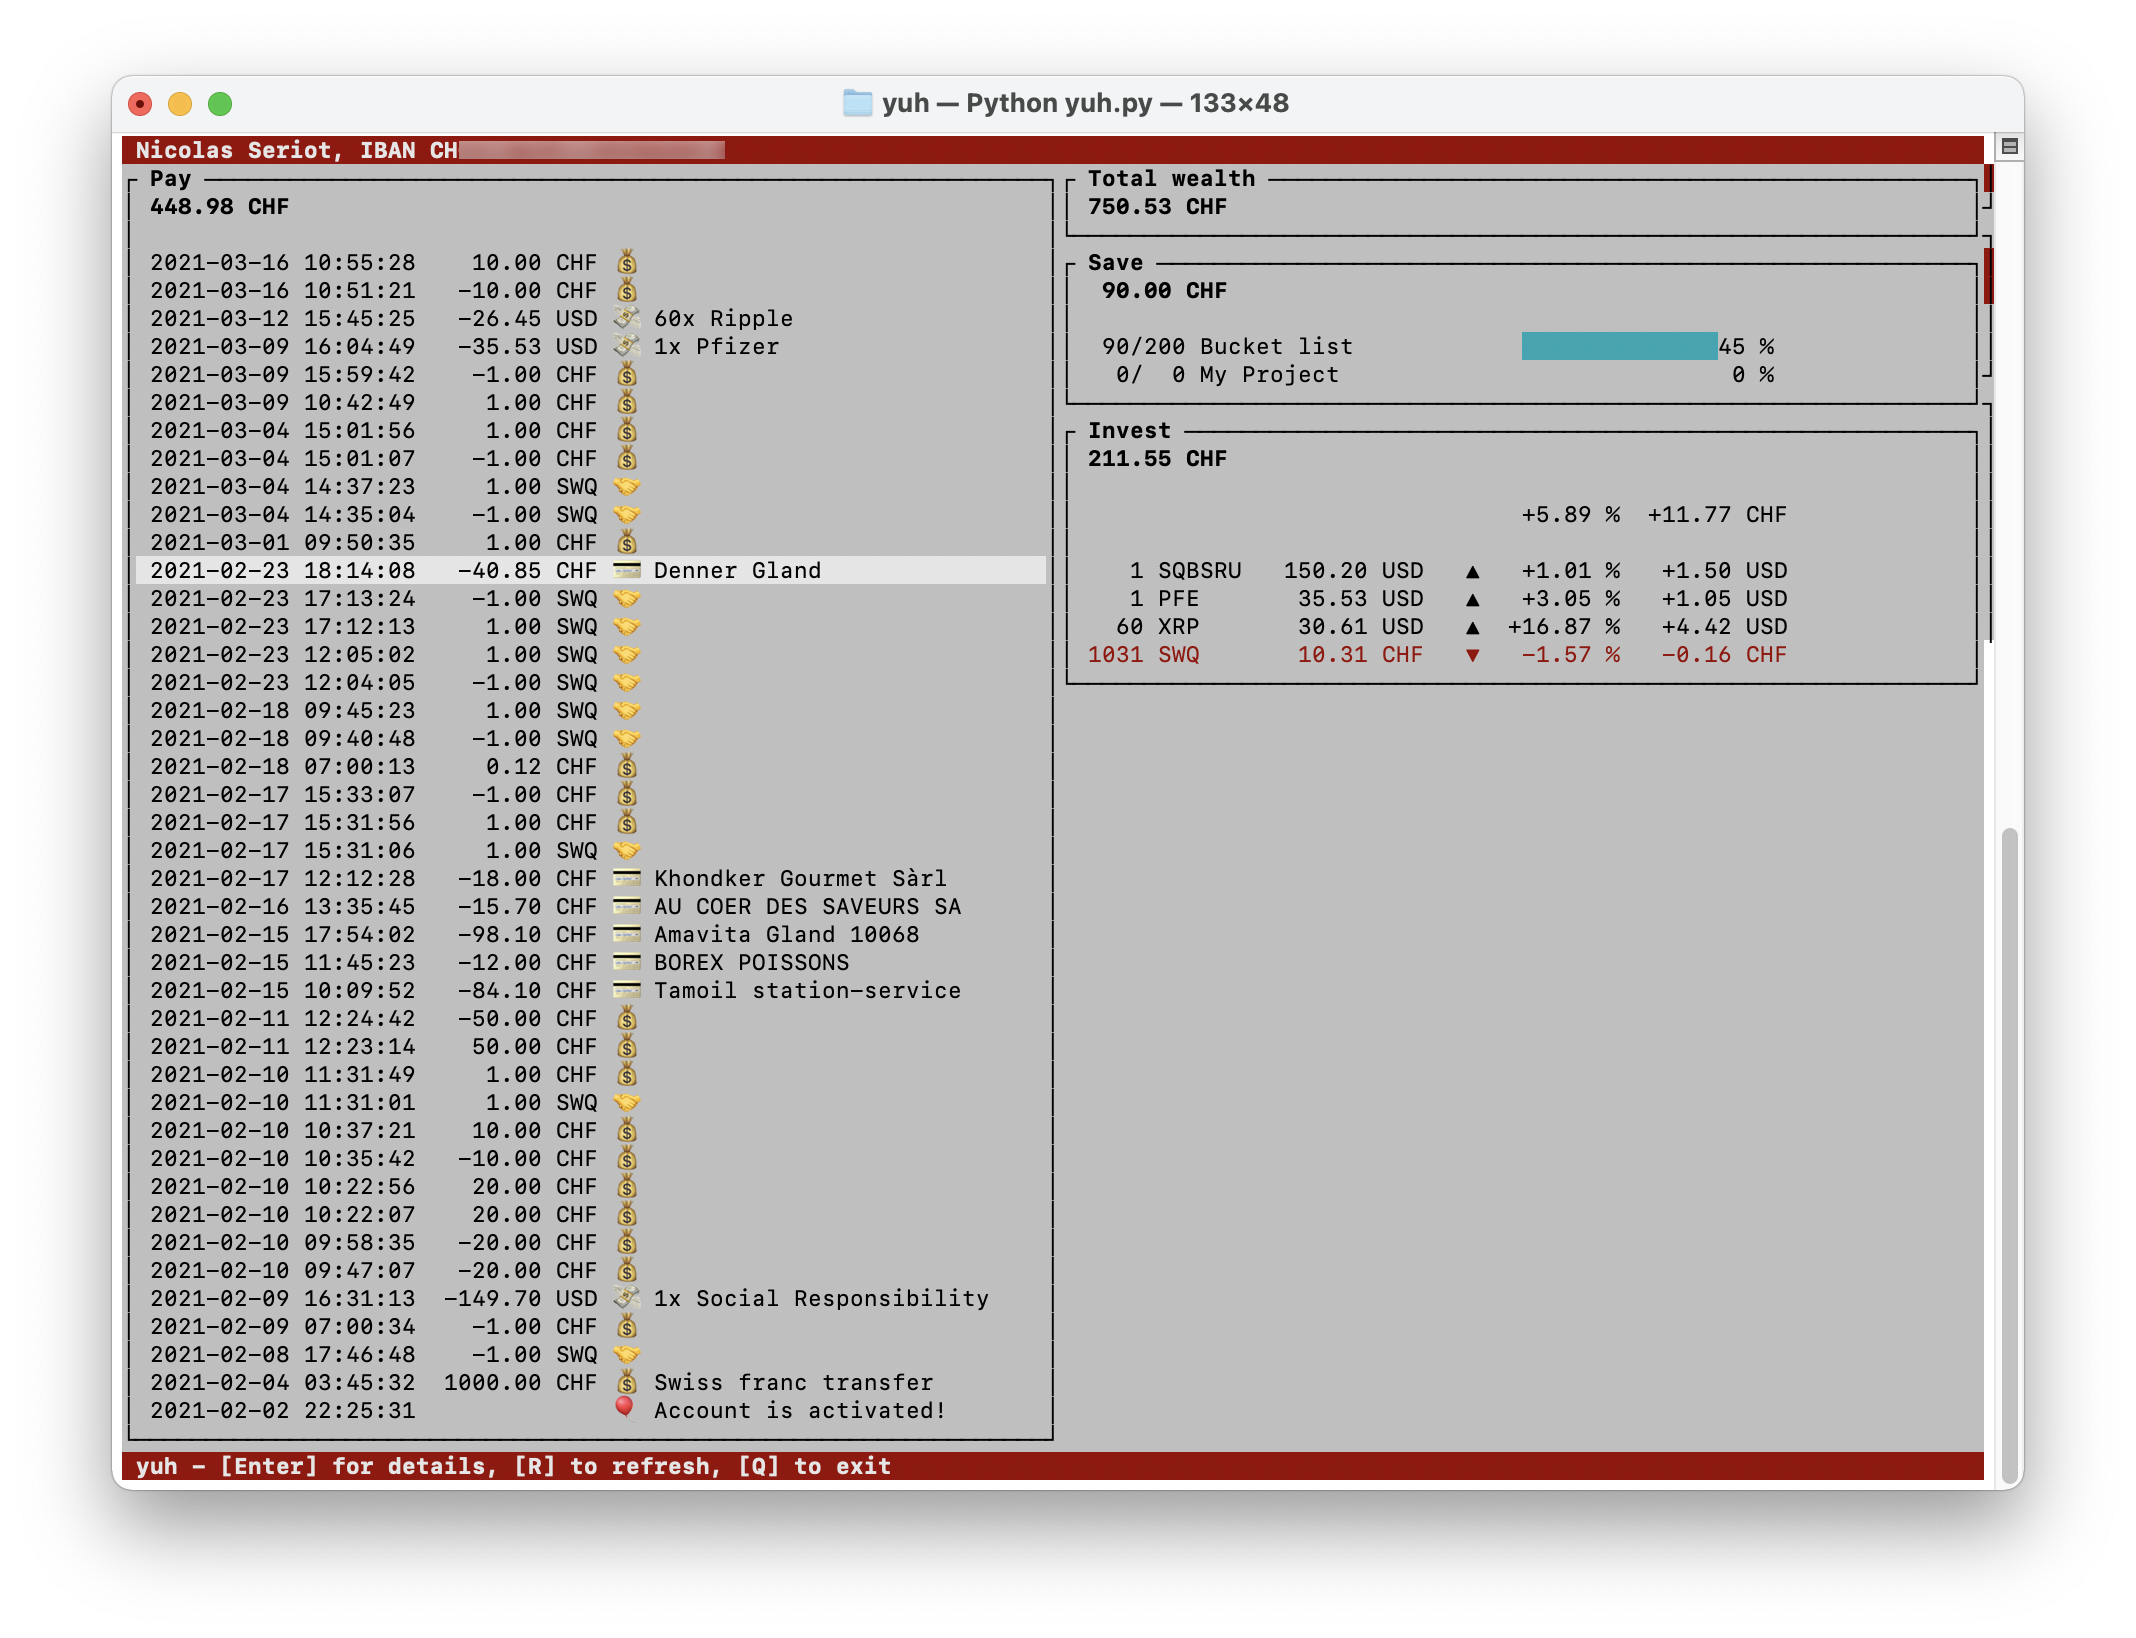
A Text User Interface over the Yuh neo-bank (undocumented) API
A Text User Interface over Swissquote Bank (undocumented) Mobile API
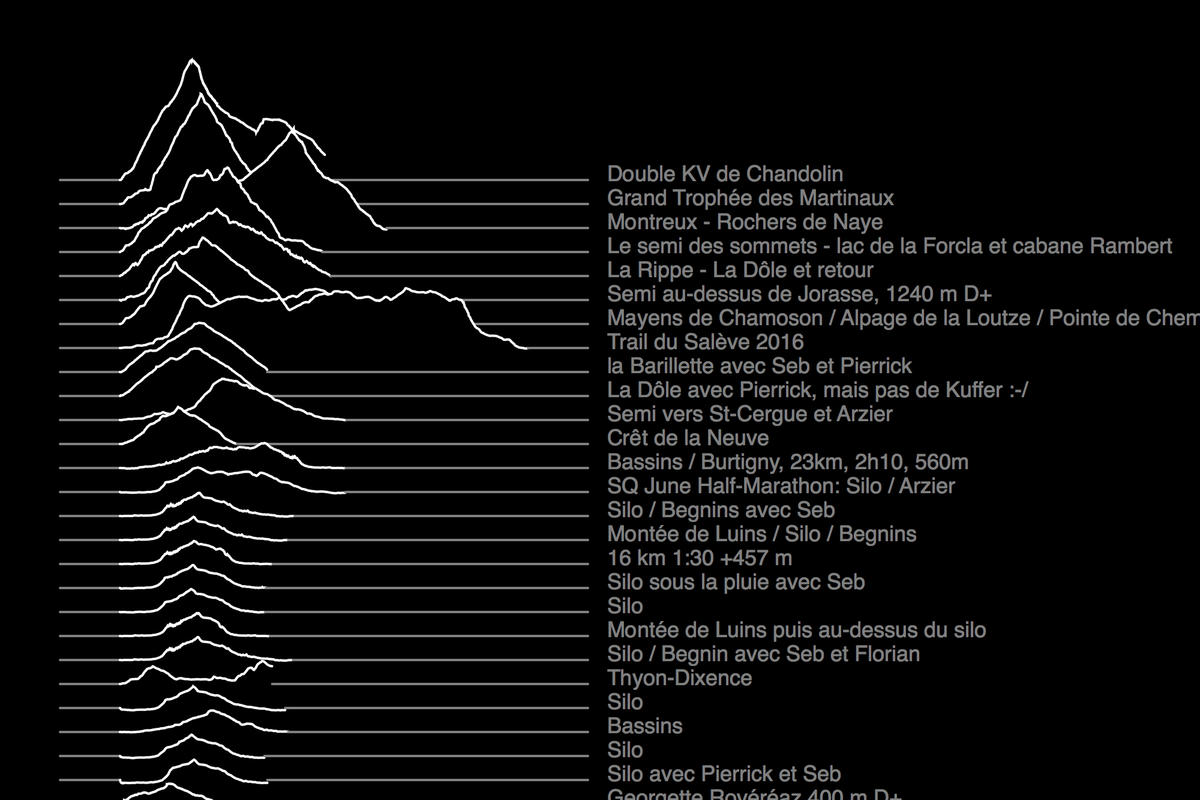
Pulsar-plot of Strava runs in Swift 3. sources
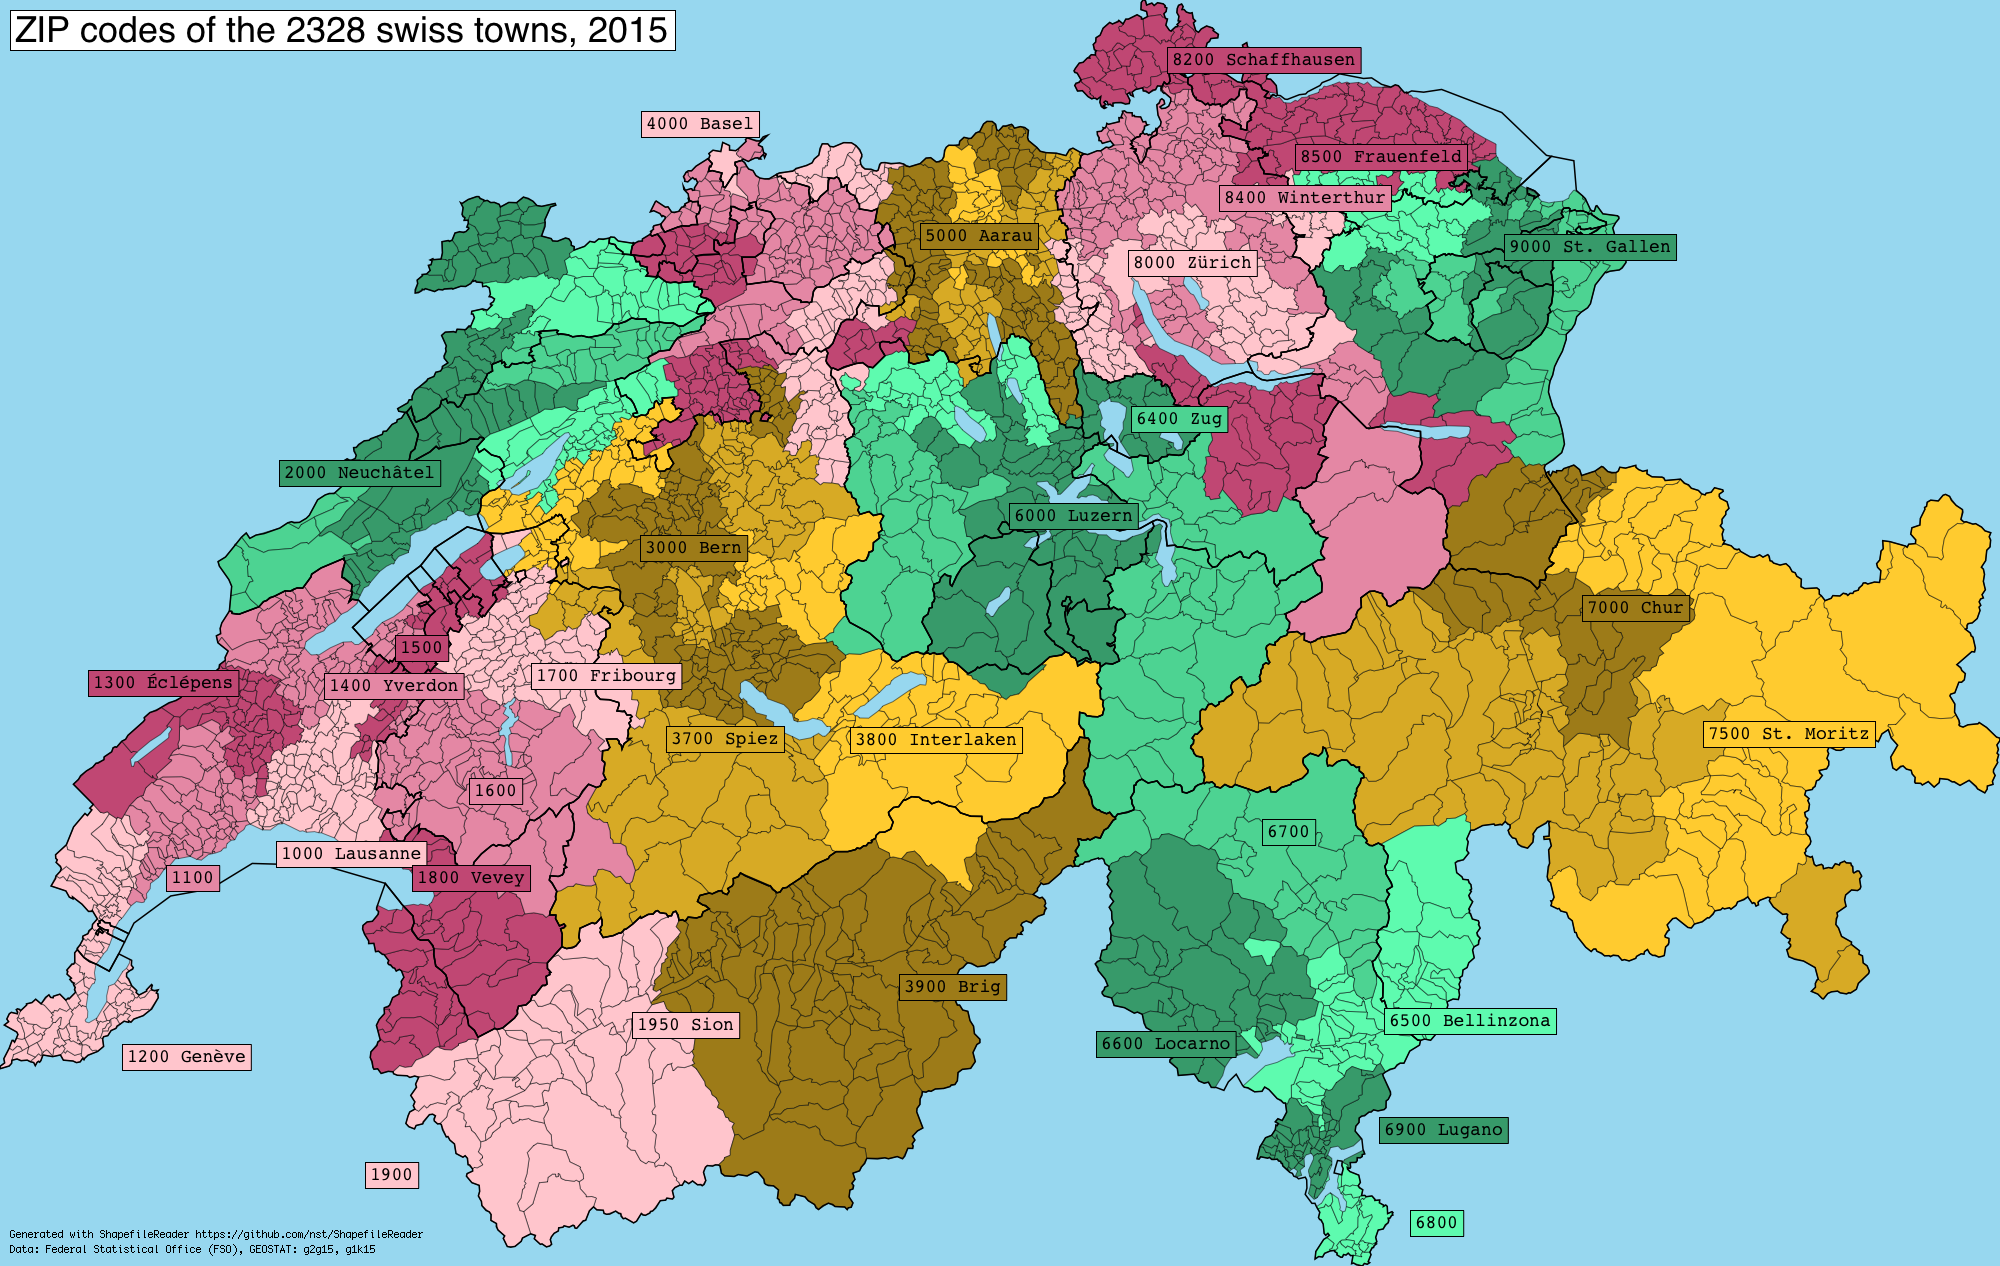
Reads Shapefile files, a geospatial vector data format. sources
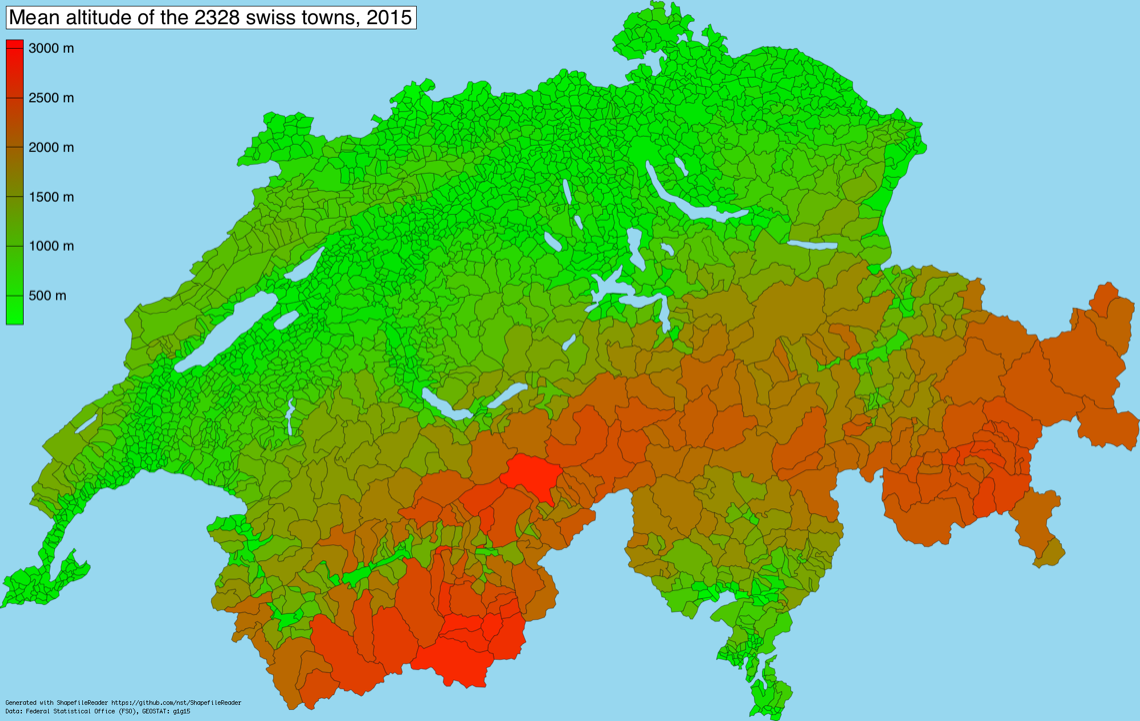
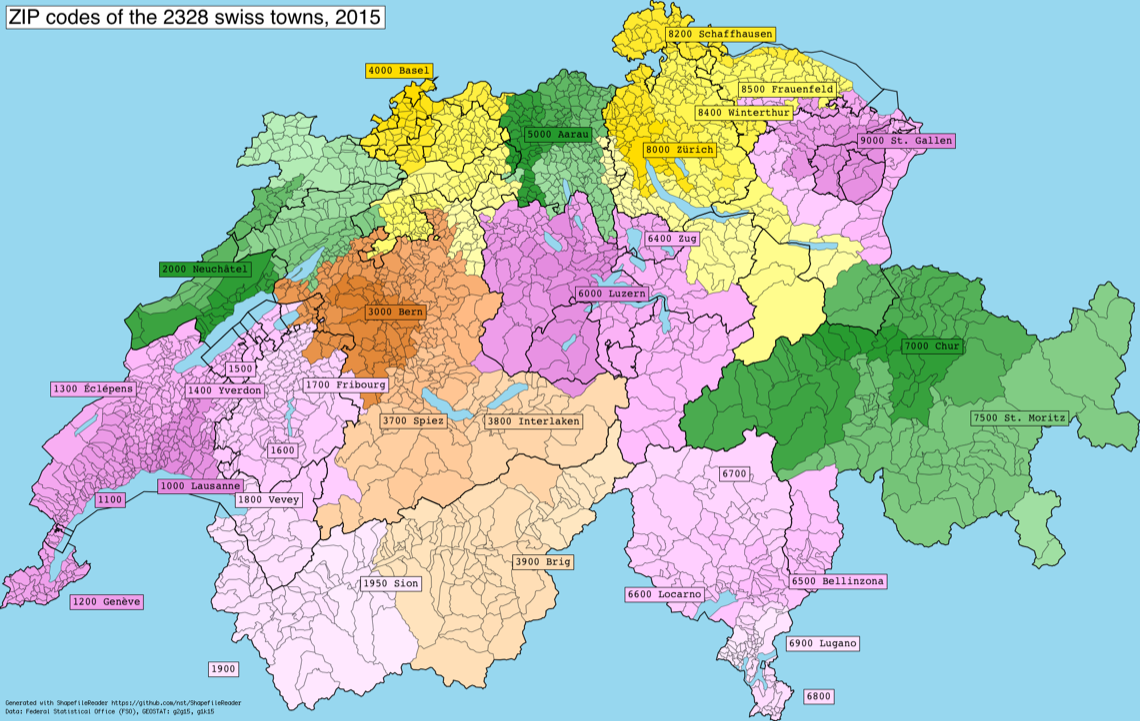
switzerland_zip.png
switzerland_zip.pdf
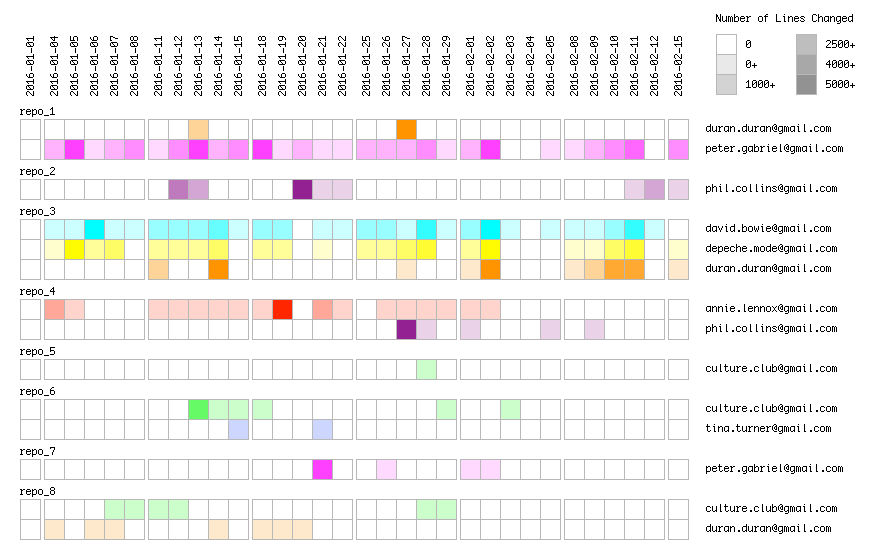
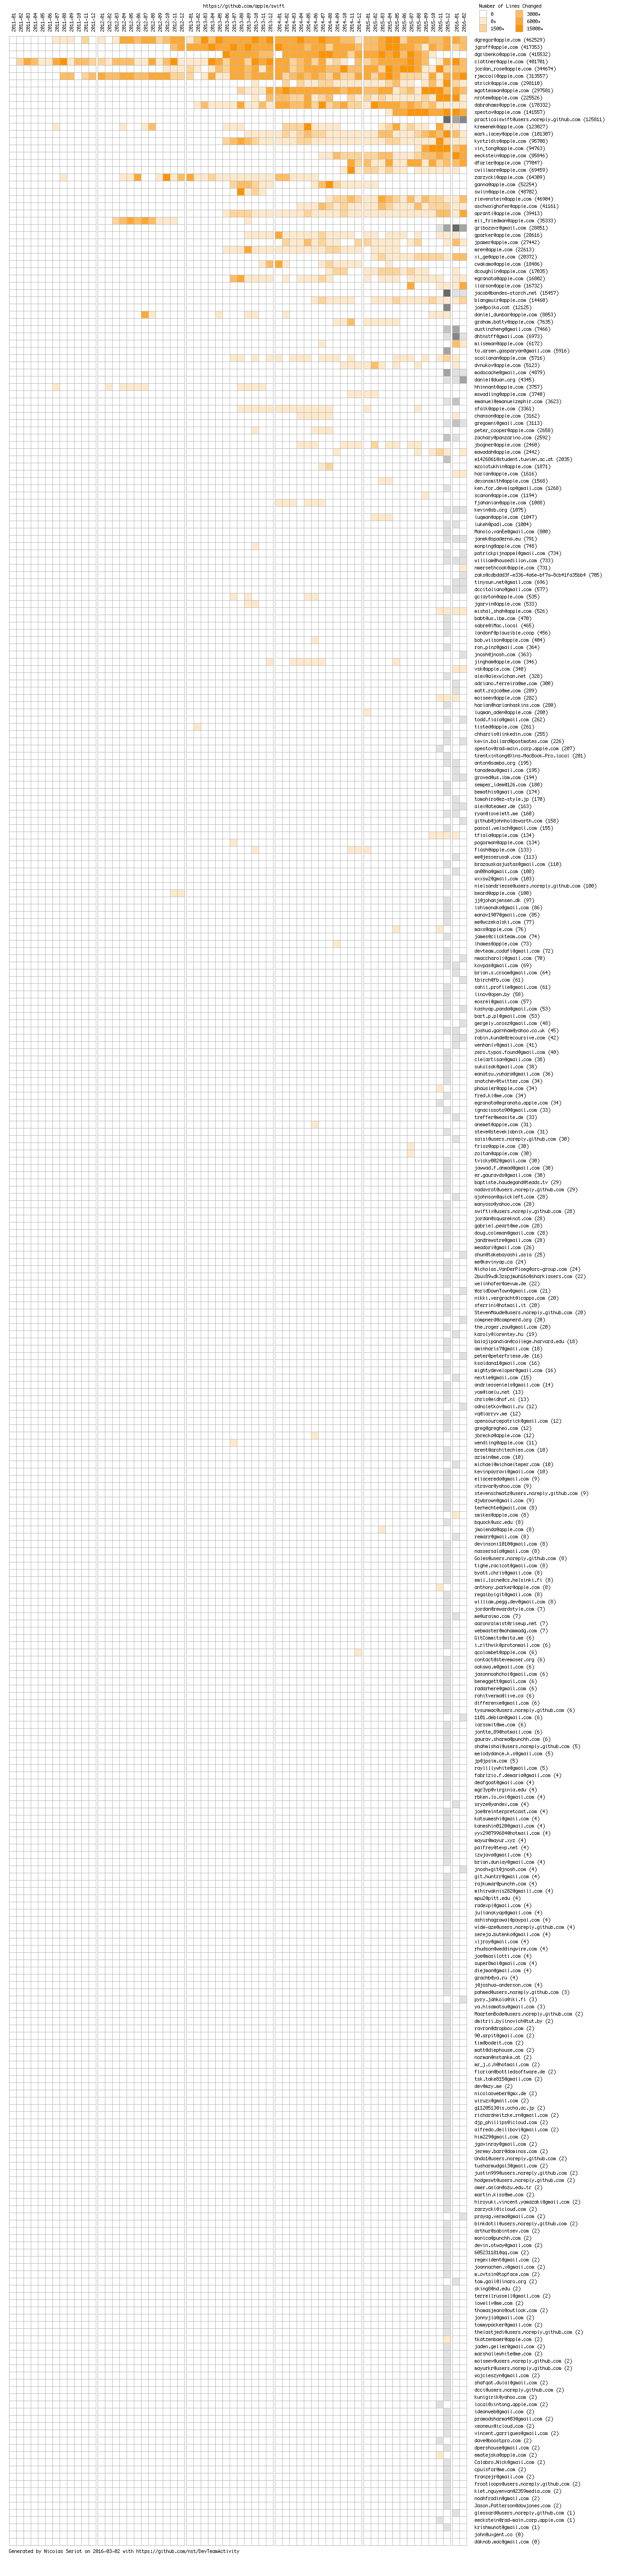
Generates a picture summarising the activity of a dev team on one or several repositories. sources
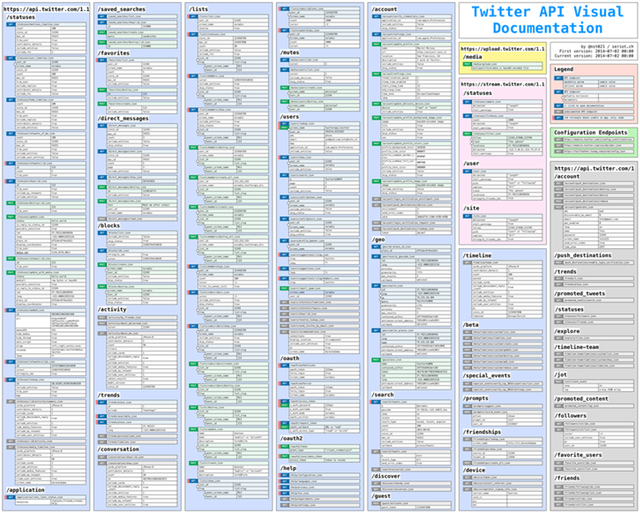
Public and private endpoints of Twitter API with their parameters.
Made with OmniGraffle.
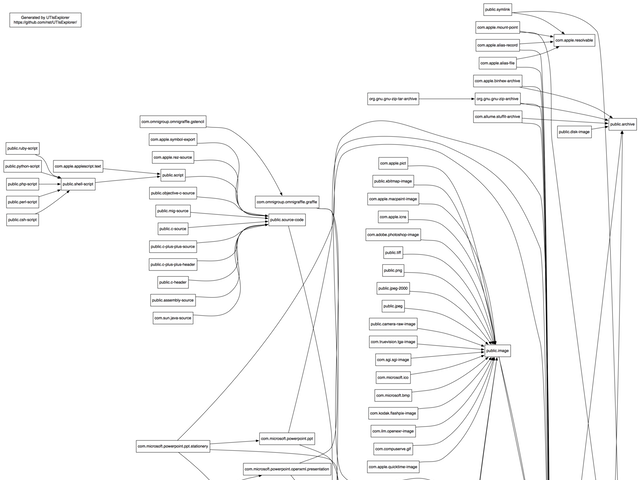
Graph of OS X UTIs inheritance.
Made with Python and GraphViz. sources
Reproducing Benjamin Kovach's art with PyCairo.
Source: kovach_pycairo.py
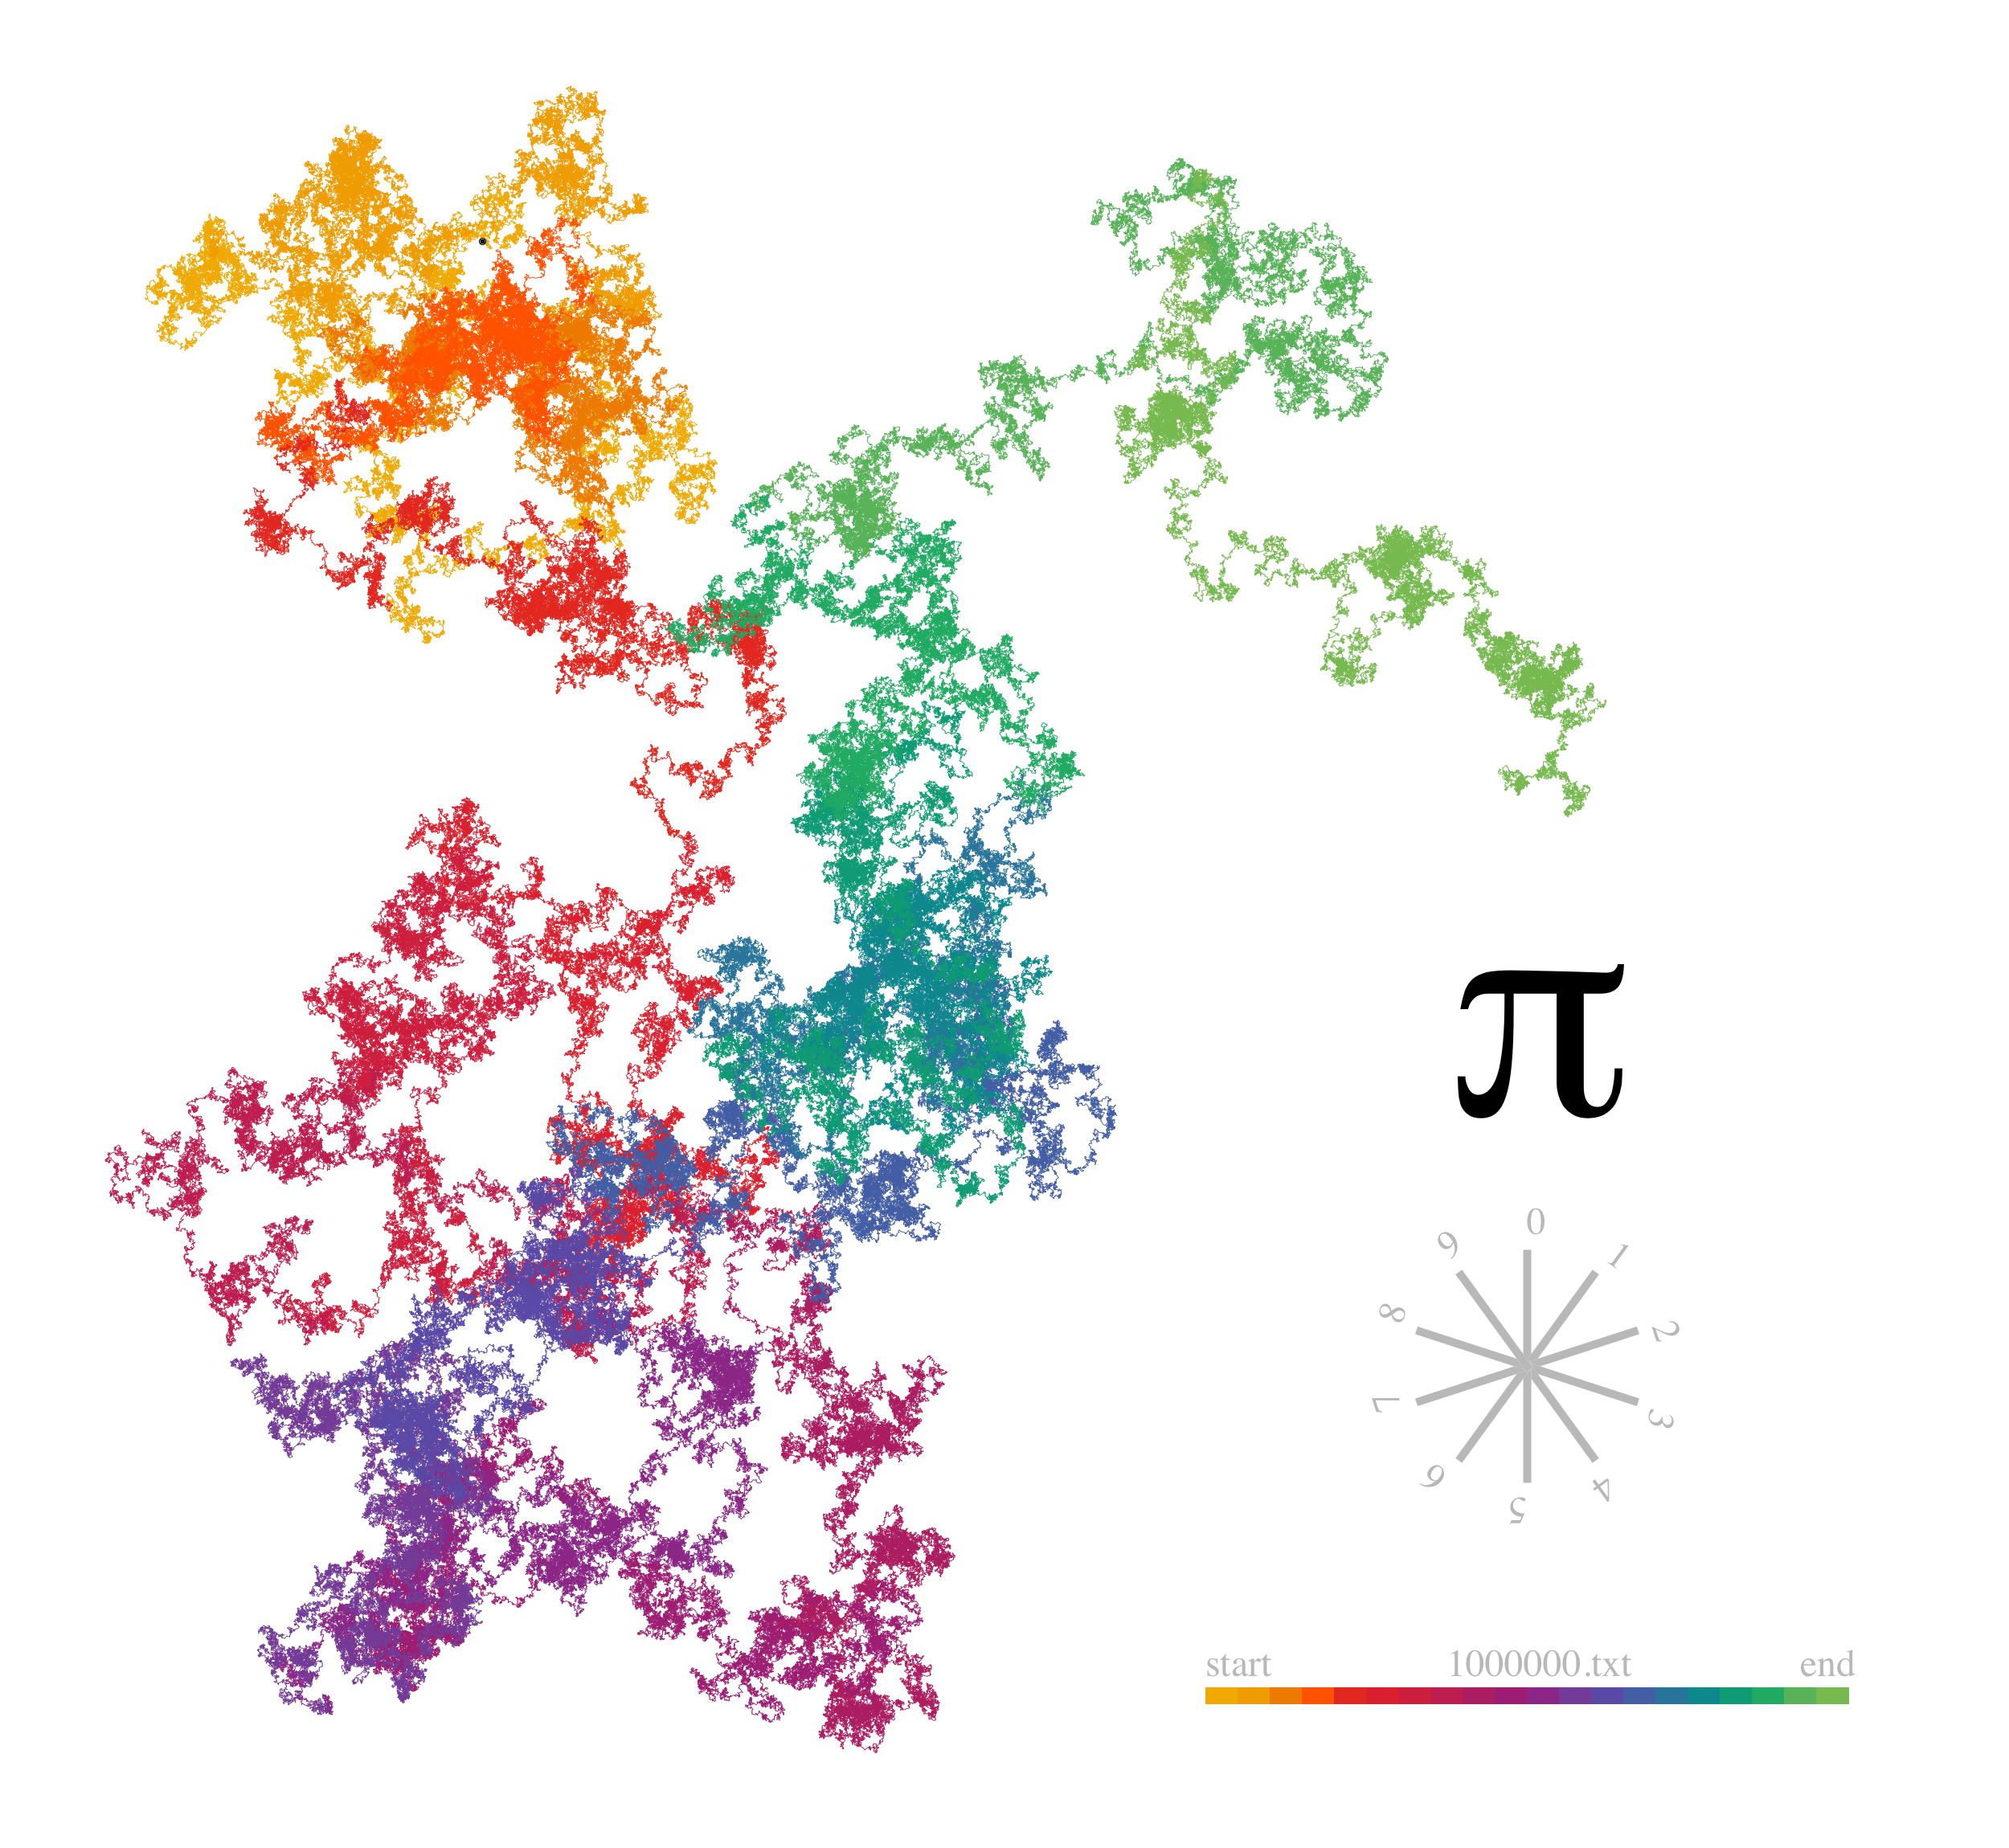
Swift implementation of Nadieh Bremer's work "Exploring the Art hidden in Pi".
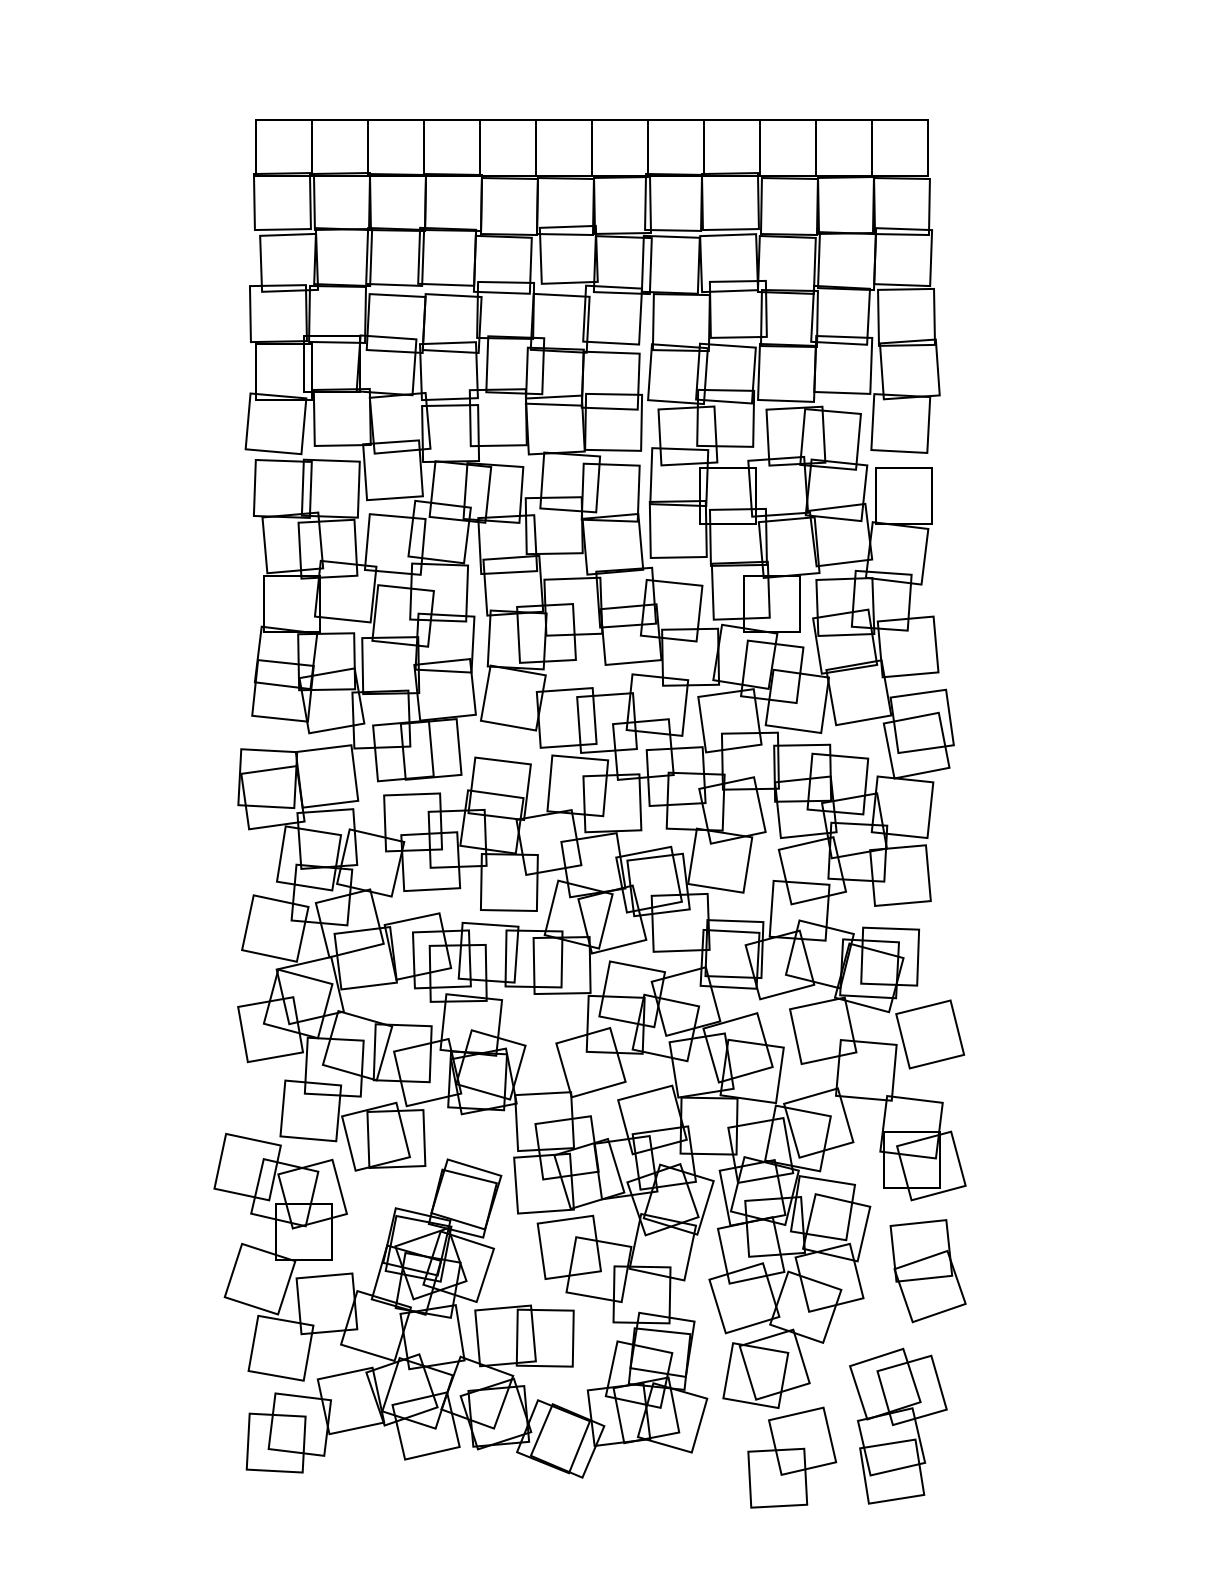
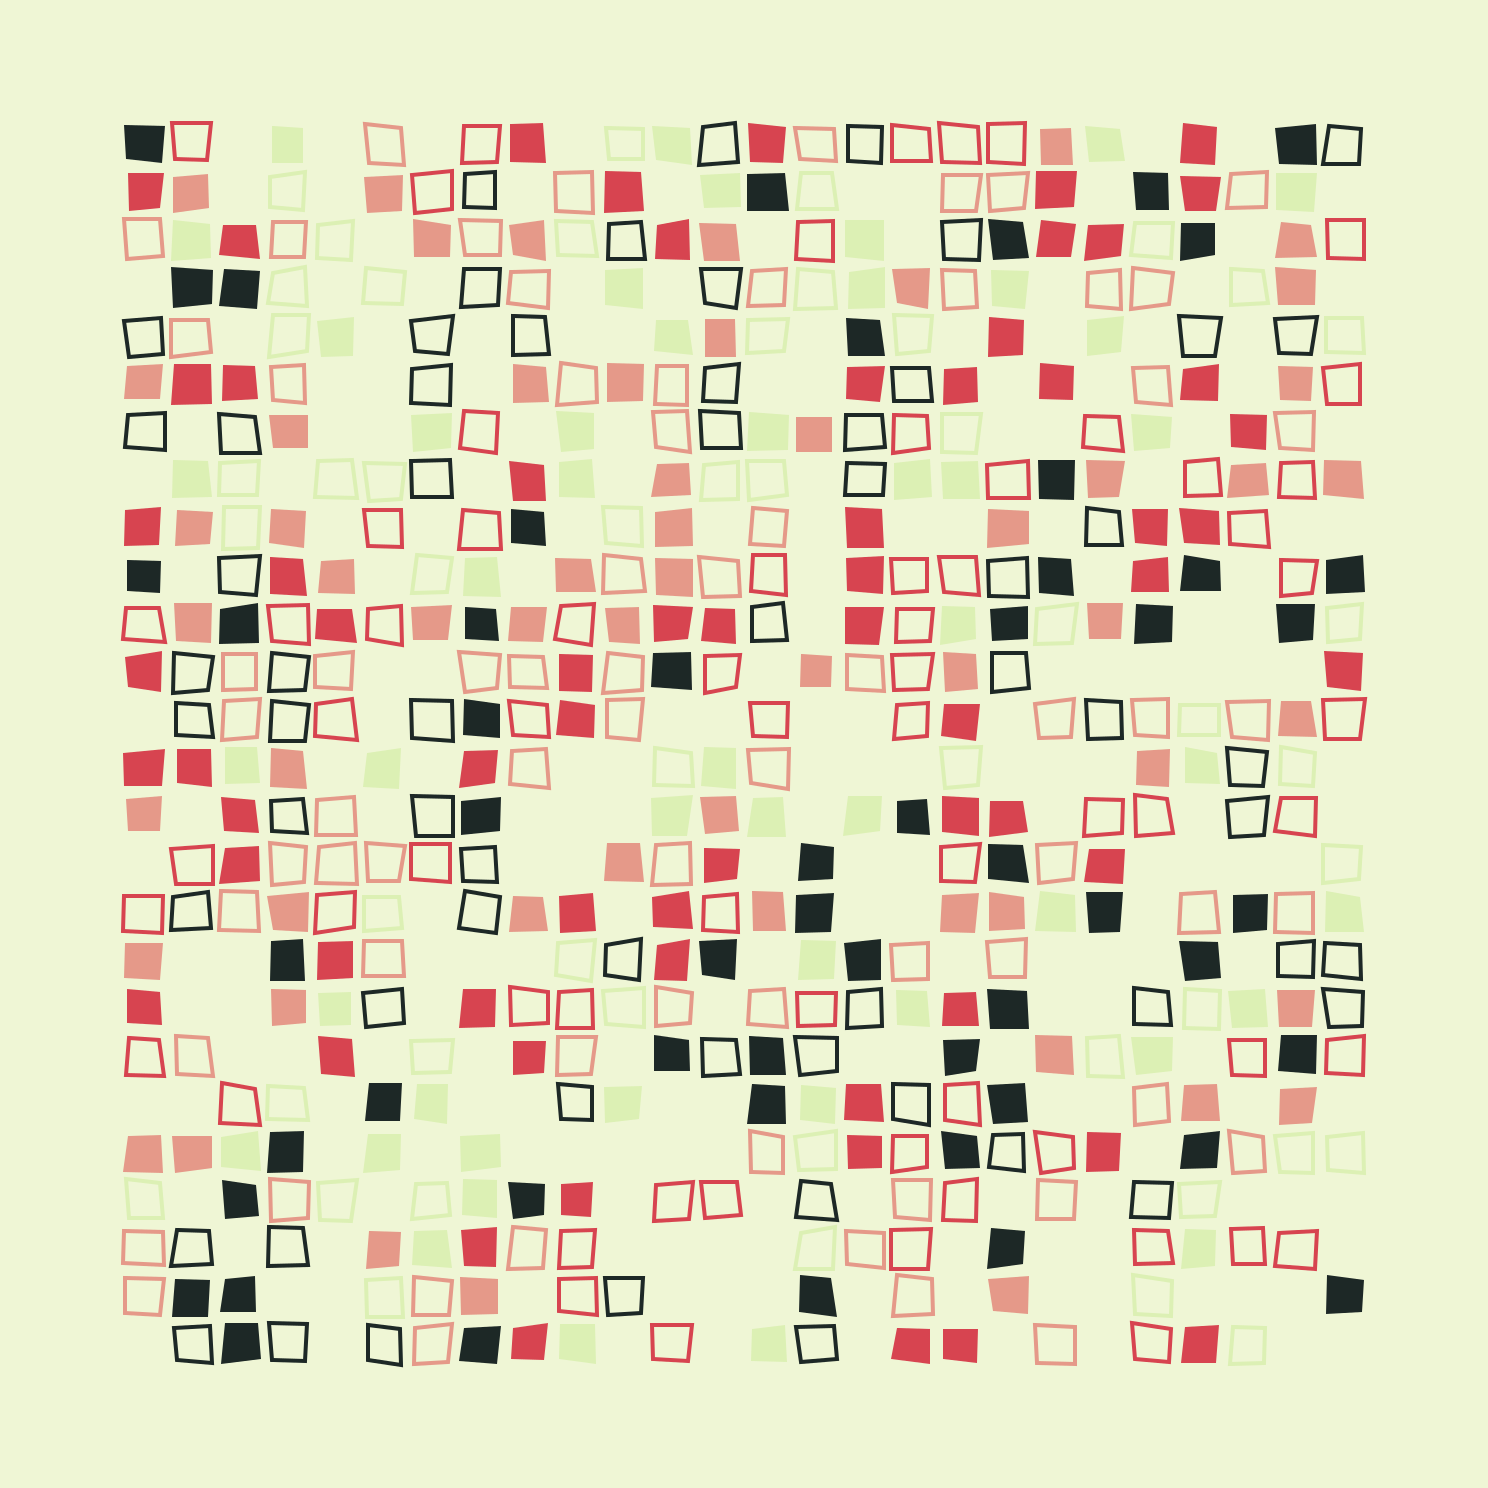
"Schotter" by Georg Nees where the idea is that randomness for x, y and rotation does increase at each row. Also created a rainbow-colored version.
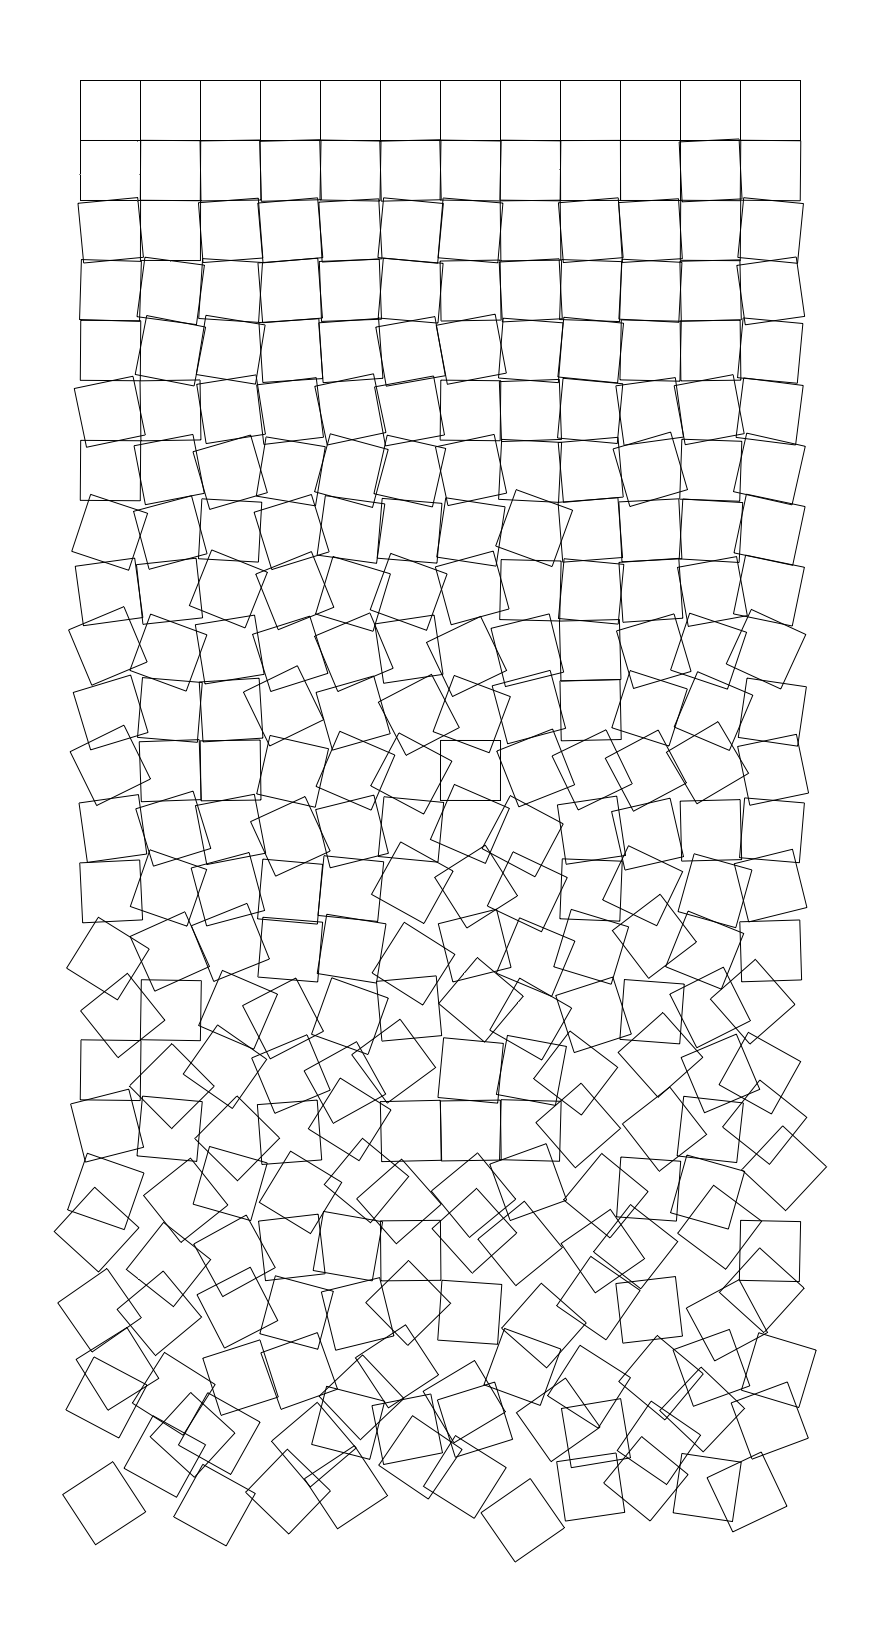
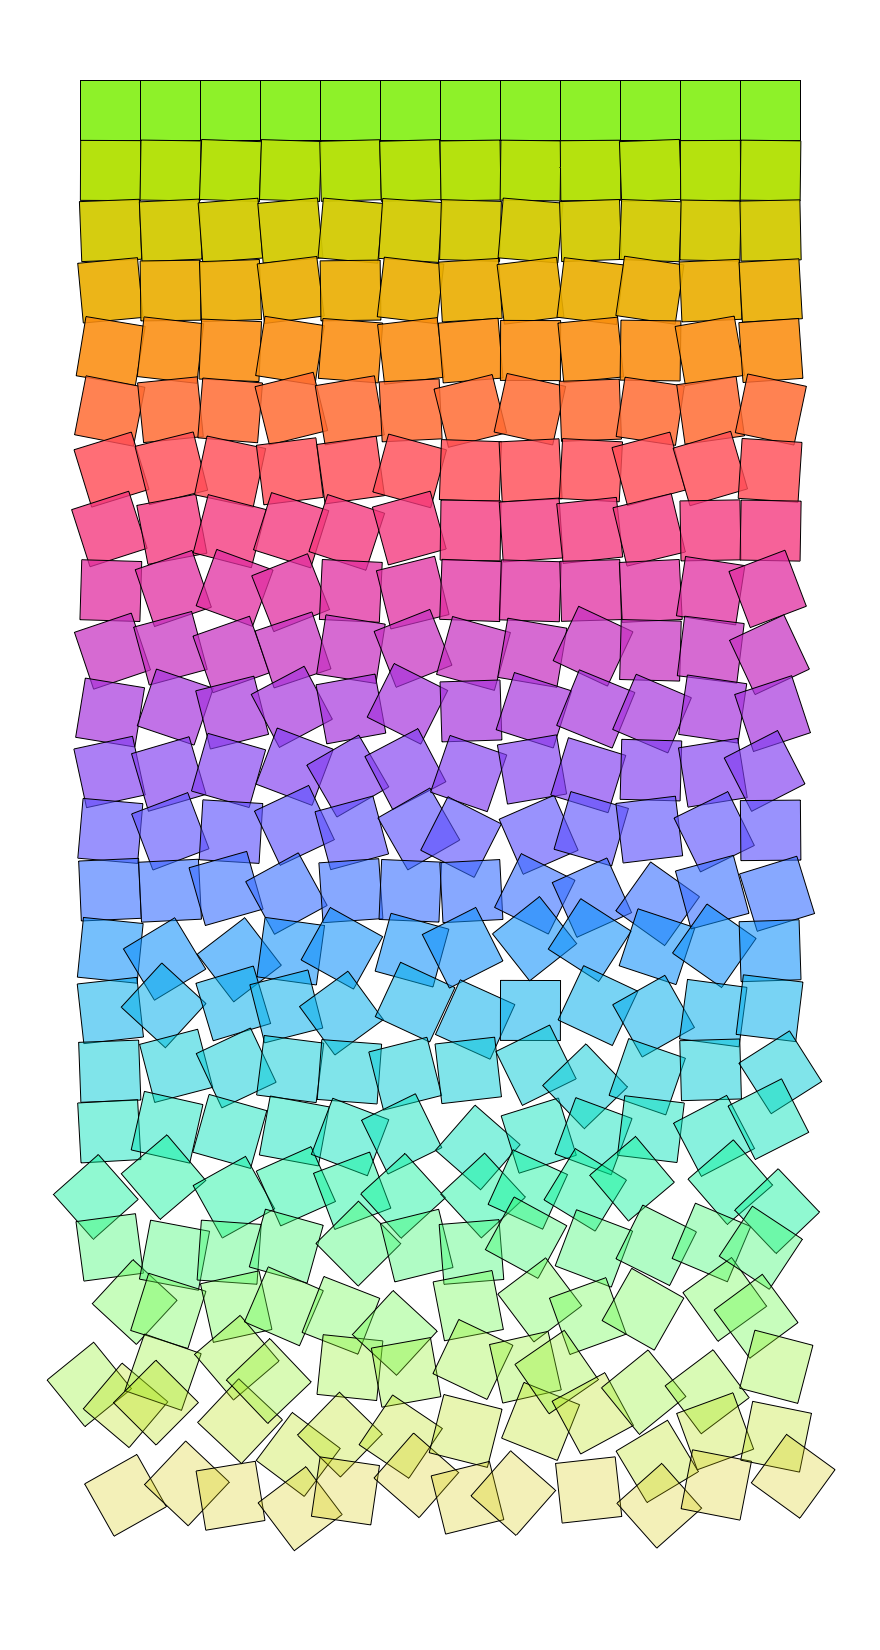
Sources in BitmapCanvas repository.
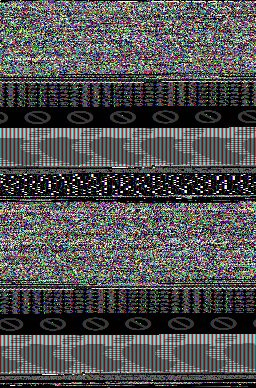
Draws any file as a picture, considering bytes as RGB values.
Made with Python. sources
$ python draw_bytes.py /usr/standalone/i386/tmbootpicker.efi tmbootpicker.efi.png
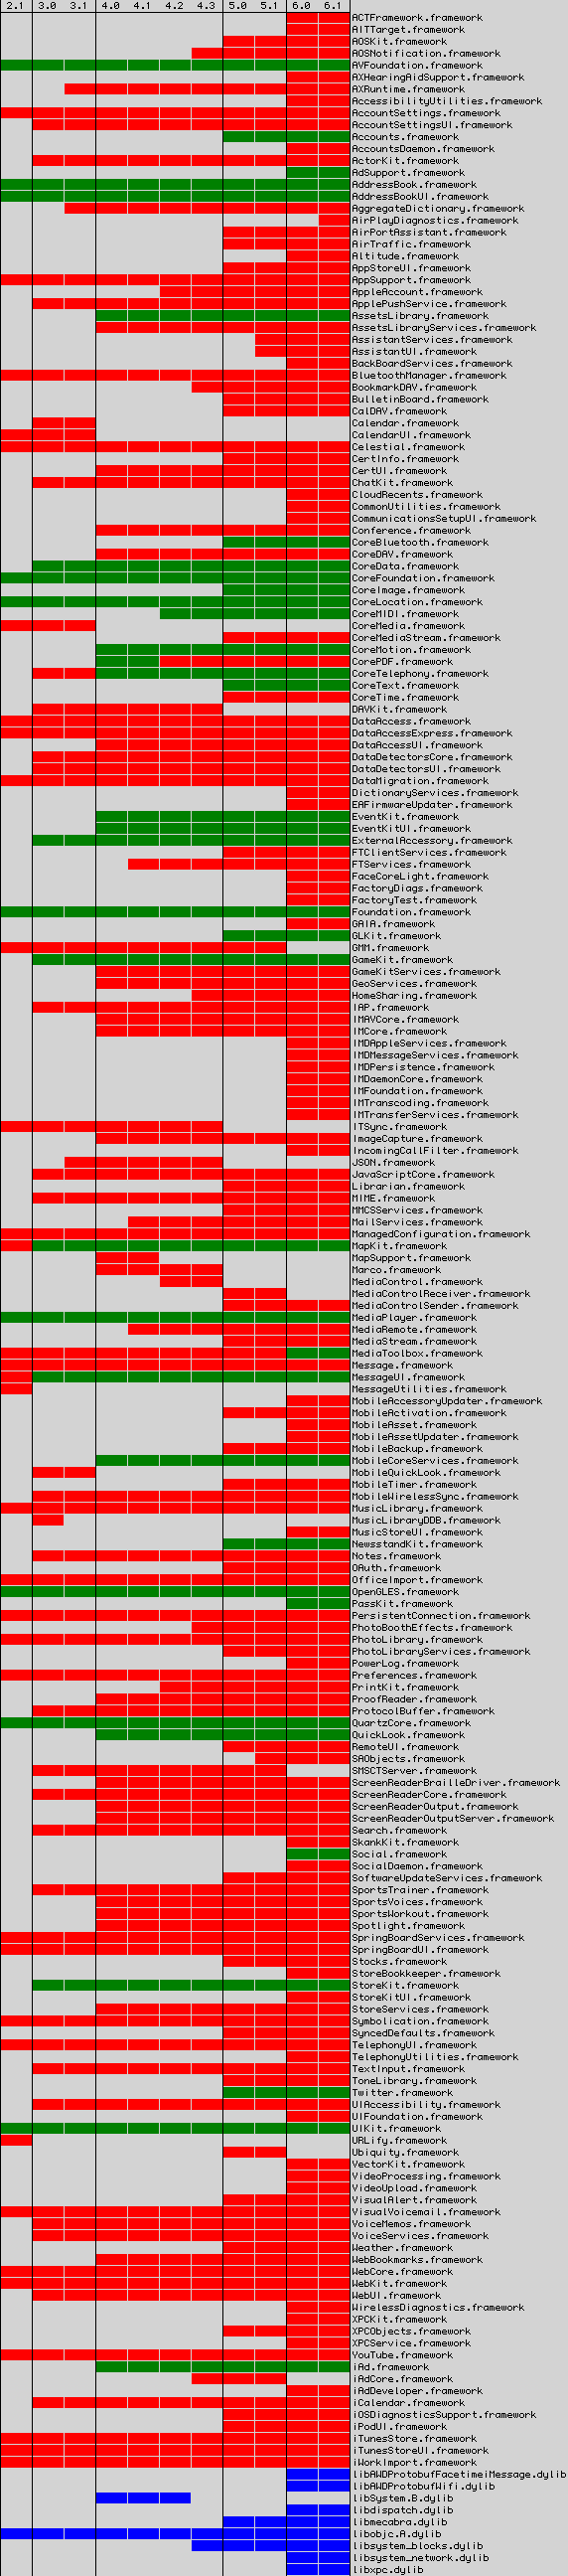
Draws a timeline of iOS public and private framworks.
Made with Swift (formerly Python). sources
A scatter plot of coffee sold at Coop supermarket.
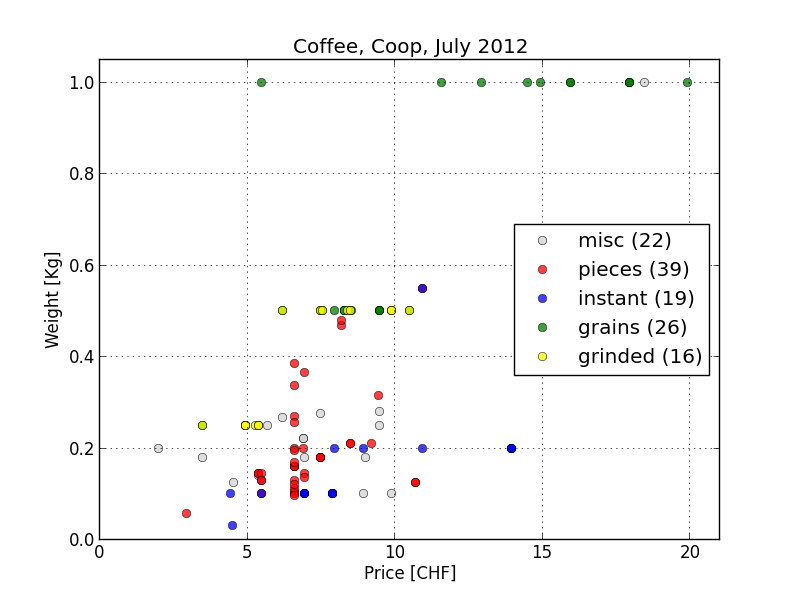
Made with Python and matplotlib. sources
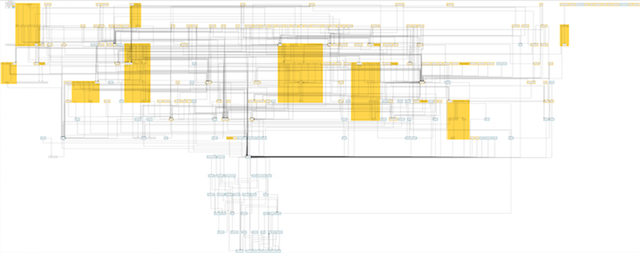
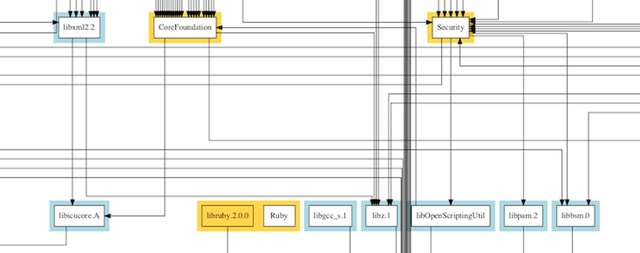
OS X frameworks and dynamic libraries dependencies.
Made with Python and GraphViz. sources
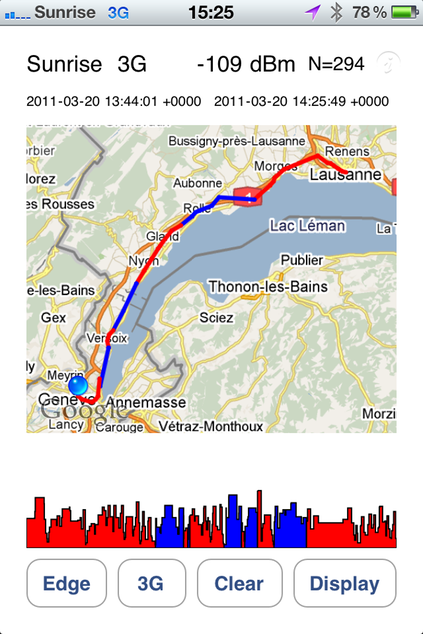
Measure and display the kind of cell phone signal (Edge or 3G) on a map.
Make with Cocoa UIKit. sources
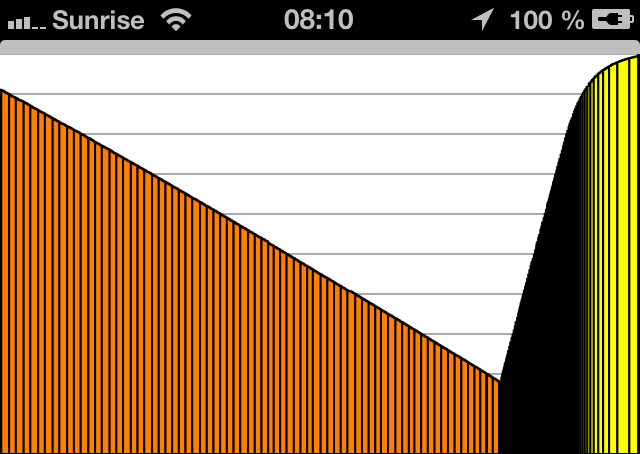
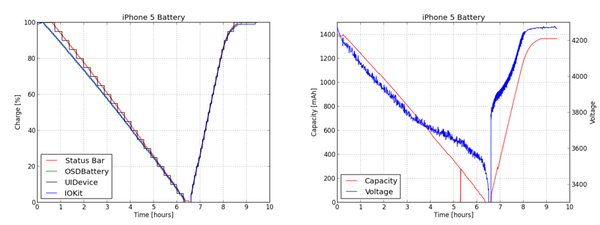
Measure and display the battery charge of iOS devices.
Make with Cocoa UIKit and Python matplotlib. sources
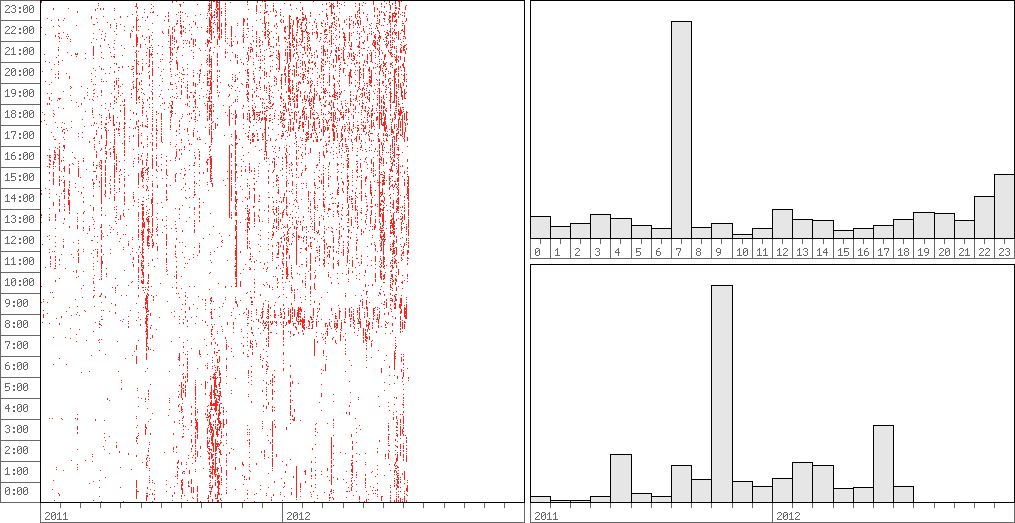
Shows the modification date of all the files in the home directory. Inspired by Stephen Wolfram personal analytics.
Made with Cocoa AppKit. Sources not yet available.
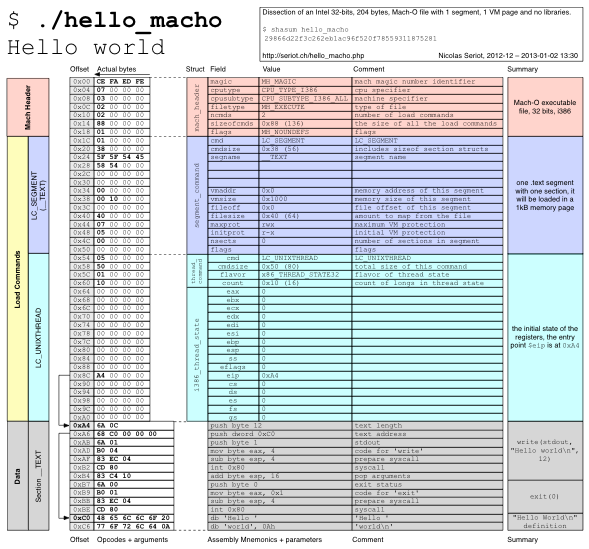
Dissection of minimal Intel 32-bits, 204 bytes, Mach-O "Hello World" executable file.
Click to get a full-scale PDF file.
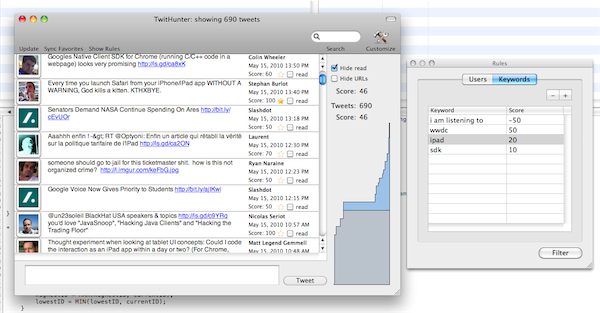
Represents the cumulated number of tweets with a certain score.
The scores are applied according to user defined rules.
Made with Cocoa AppKit. sources
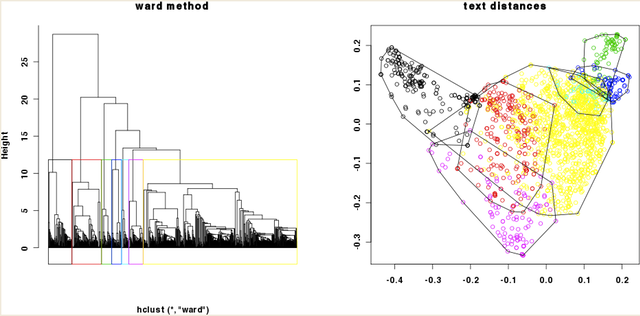
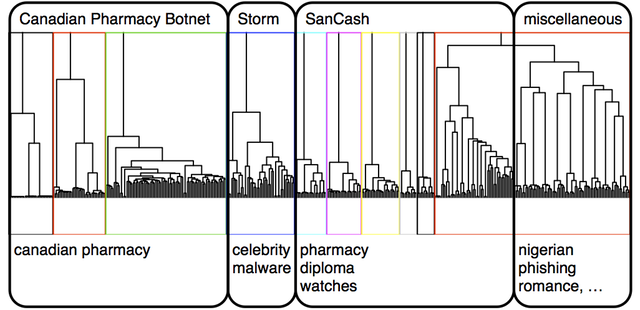
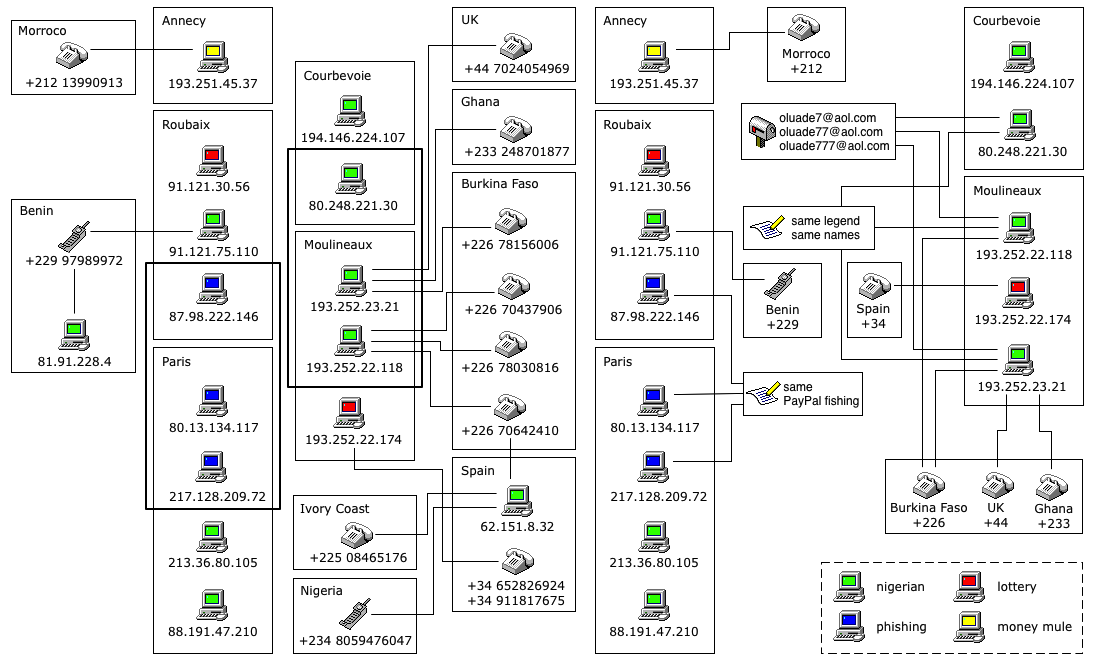
Here are several diagrams revealing links among messages, giving investigators stategic and tactical intelligence. These pictures are taken from my Master's thesis in Economic crime investigation.
Made with Django, R and OmniGraffle. Source not available.
Emails can be represented in time and space.
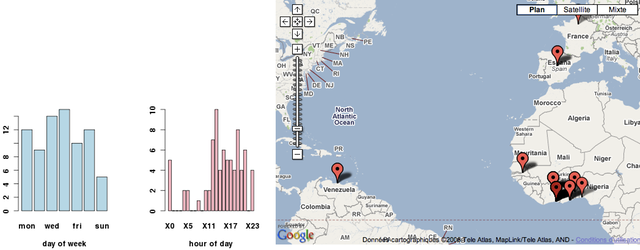
A 2D map and a dendrogram showing clusters of similar messages.
The source and type of scams can be summarized with this oval diagram.
On the left, we draw links between messages, using "hard informations" (IP addresses, phone numbers, ...). One the right, we continue filling the chart, drawing further links and using "soft informations" like the kind of scam.
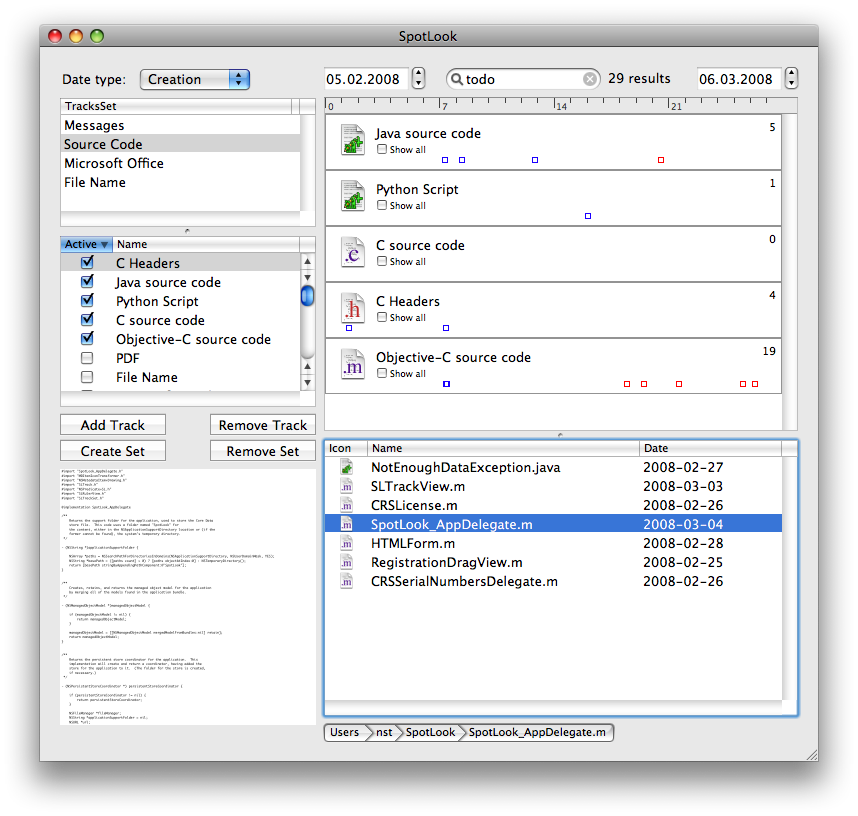
An innovative Mac OS X search tool based on Spotlight.
Based on my software engineering thesis at EIVD 2006.
Experimental visualisation of runs using Swift and Strava API. sources
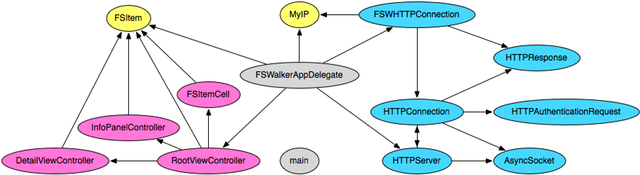
Dependencies in Objective-C classes.
Made with Python and GraphViz. sources
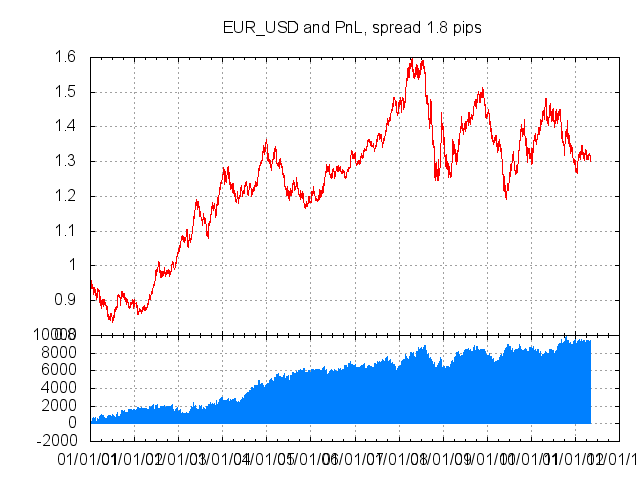
Evaluates a trading strategy with historical prices.
The upper chart shows the prices. The lower one shows the profit.
The heatmap shows the profit according to the time and a parameter of the trading strategy.
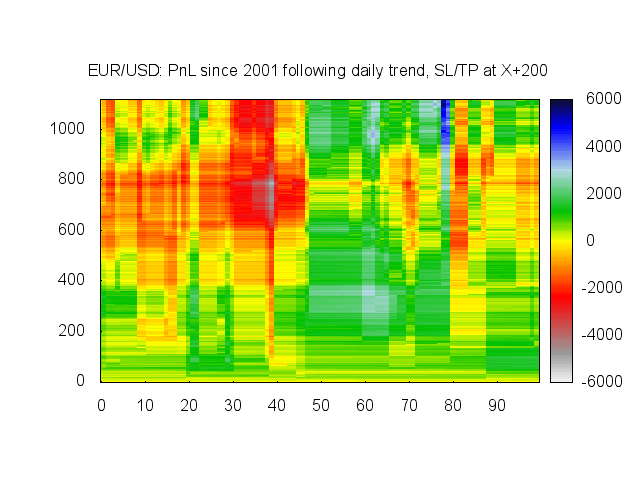
Three more charts show the volatility of EUR/CHF. Abscissa represents hours of the week. Ordinate represents the weeks themselves. The top is January 2001, the bottom August 2011.
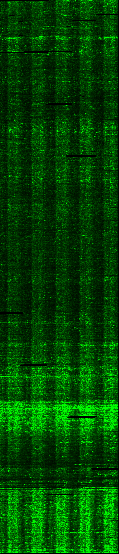
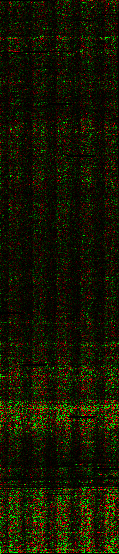
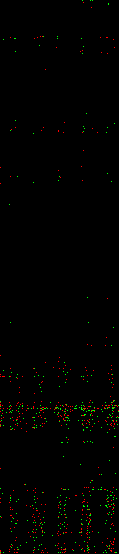
Made with Python and GnuPlot. sources
Read the start and stop time where the Mac OS X was used, display these sessions in iCal.
Made with Python and iCal. sources

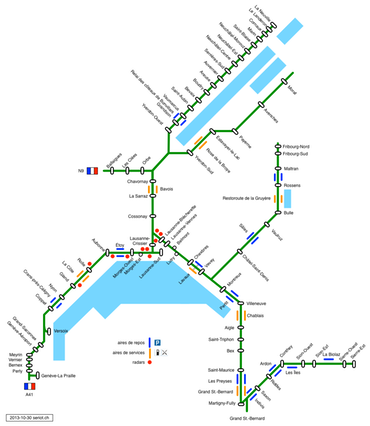
Here are my attempts to make new maps of Western Switzerland. The goals are to explore alternative representations of the Swiss highways network and to create maps that fullfil my actual needs.
Click on the maps to display the original PDF ones.
The first map simplifies quite a bit the shape of the network. It tries to respect geography. The map also shows rest areas, gas pumps and clickable red dots for speed radars.
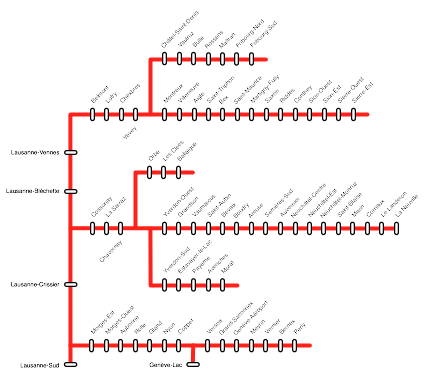
The second one does not respect geography anymore. It is just the topology of the network, as the one on this French highway ticket. It start from Lausanne on the left and extends to the right.
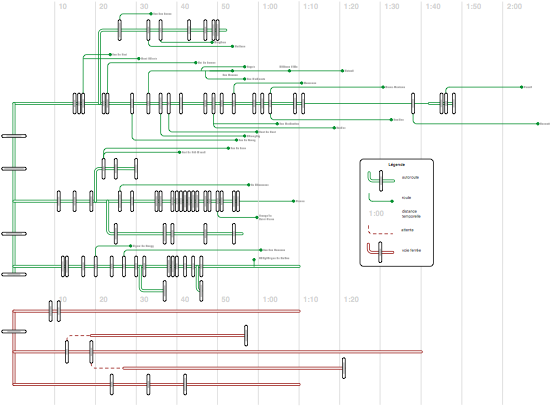
The third map is an evolution of the former network representation. It shows the places proportionnaly to the travel time by car from my home in the center of Lausanne. It shows highways exits, but also nice touristic places you can reach through the given exits. At the bottom of the map, you can also see several places reachable by train.
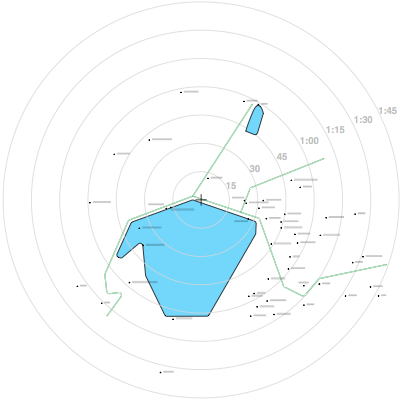
This map displays more or less the same places as the previous one. However, it tries to respect the geographical layout instead of highways network topology. Space is still distorted to match the travel time from my home. This whole map can be generated by a script, except the roads and the lake which are added by hand. This is the artistic touch. This map could and will be improved, but you get the idea.
I posted the source code and described the process to generate such a map out of a Google Map on github.